
Appearance
My Charts
See Which Charts Feature Your Podcast
My Charts shows you exactly which platform podcast charts your podcast appears on right now, along with its rank on each one. It pulls together your chart placements across the major listening platforms so you can see your competitive position at a glance and track how each placement has moved over time.
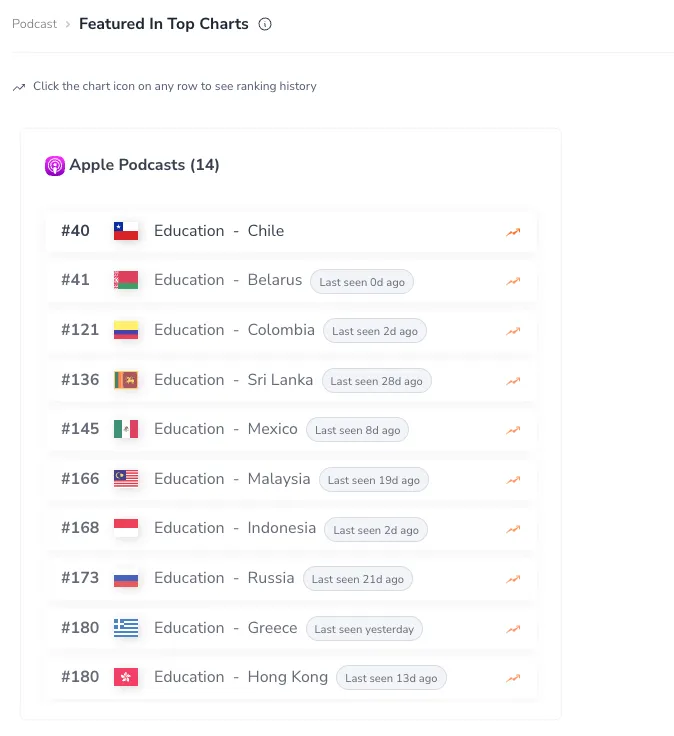
Overview
Chart placements are valuable indicators of podcast discoverability. My Charts lists the charts your podcast is currently featured on, grouped by platform, and gives you a count of your total chart placements. For each placement you can open a ranking history to see how your position has changed.
The data reflects a rolling 30-day window, so My Charts shows where you've been charting recently — both the charts you're on now and any you've slipped off in the past month.
Key Features
Charts Grouped by Platform
Your placements are organized by the platform they belong to, so you can quickly see where you're charting:
- Apple Podcasts - Current Apple Podcasts chart placements
- iTunes (Legacy) - Legacy iTunes charts, still maintained for podcasts that predate the Apple Podcasts relaunch
- Spotify - Your placements in Spotify's podcast charts
- Amazon Music - Rankings in Amazon Music's podcast charts
- YouTube Music - Your placements in YouTube Music podcast charts
Each group is labeled with the platform and shows how many charts you appear on there.
Placement Details
Within each platform group, every chart placement shows:
- Your rank - The position your podcast holds on that chart
- The country - Which country's chart it is, shown with a flag
- The chart name - The specific chart or category you're appearing on
- Recency - If you're no longer actively charting on a placement, you'll see when it was last seen (for example, "Seen 3d ago")
Ranking History
Click any chart row to open its ranking history. This reveals how your position on that specific chart has moved over the rolling window, so you can see whether a placement is trending up, holding steady, or slipping.
How to Use My Charts
- Review your placement count - The summary at the top tells you how many charts currently feature your podcast.
- Scan by platform - Work through the platform groups to understand where you're strongest and where you have placements you might not have noticed.
- Open a ranking history - Click any row to see how that placement has changed over time, which helps you connect movement to recent episodes or promotion.
- Watch for dropped placements - Rows marked with a "last seen" note are charts you've recently fallen off, signaling where to focus next.
Understanding Your Chart Data
What the Placements Tell You
- Current rank - Where your podcast stands on each chart it appears on
- Platform spread - Which platforms are giving your podcast chart visibility
- Country reach - The country charts your podcast is landing on
- Recent momentum - Whether placements are holding or you've recently dropped off
Reading Ranking History
The per-chart history helps you spot patterns:
- Entry points - When your podcast first appeared on a chart
- Sustained performance - How long you've held a placement
- Peaks - Your strongest position on a given chart
- Declines - When and how a placement started slipping
Using Chart Data for Strategy
Performance Analysis
- Trend identification - Use ranking history to spot patterns in how your placements move
- Platform comparison - Understand which platforms give your content the most chart visibility
- Content correlation - Connect specific episodes or releases with changes in your chart placements
Competitive Intelligence
- Market position - Understand your competitive standing within the charts you appear on
- Opportunity identification - Notice charts where you're close to a stronger position
- Strategic planning - Use your placement data to inform content and promotion priorities
Maximizing Chart Performance
Content Strategy for Charts
- Release timing - Plan content releases to maximize chart impact
- Episode quality - Focus on content that drives sustained engagement
- Series planning - Develop content series that maintain chart momentum
- Audience engagement - Build loyal audiences that support consistent chart performance
Building on Your Placements
- Reinforce strengths - Promote the charts where you're already performing well
- Pursue near-misses - Focus effort where your rank is close to a meaningful threshold
- Recover dropped placements - Use the "last seen" signals to identify charts worth winning back
Advanced SEO Strategy: Chart appearances create authority signals that benefit your podcast's overall search performance. Podcasts that regularly appear in charts often see improved search rankings and organic discovery across platforms.
Chart Performance Indicators
Strong Chart Performance
- Consistent appearances - Regular presence across relevant charts
- Upward trends - Improving positions in your ranking history
- Multiple platform success - Placements across different platforms
- Category strength - Strong rank in relevant genre charts
Opportunities for Improvement
- Inconsistent performance - Sporadic placements that could be stabilized
- Single platform focus - Success on one platform that could be expanded
- Recently dropped charts - Placements you've slipped off that could be recovered
Integration with Other Features
SEO and Discovery
- Search performance - Chart success supports overall search rankings and discoverability
- Keyword strategy - Use chart performance to inform keyword and content strategy
- Competitive analysis - Compare your placements with competitors for strategic insight
Performance Monitoring
- Audience insights - Use chart data to understand audience preferences
- Content strategy - Inform future content decisions based on chart performance patterns
Related Features: My Charts works closely with All Charts, where you can browse every chart by platform and country to find the placements you could climb next. It also pairs well with the Planner's metadata alignment for optimizing chart-driving content and Competitive Analysis for understanding your position in the chart landscape.