
Analytics
Read listening and viewing reports next to your podcast's discovery work. Analytics keeps each source's own measurements visible: host downloads, Spotify plays, Apple listening, and YouTube views describe different things and must not be added into a single audience total.
To access: choose your podcast, then click Analytics in the sidebar. The source bar contains Spotify · YouTube · Apple Podcasts, your supported host's name (such as Spreaker, Buzzsprout, Simplecast, Captivate or Transistor), Tracker for OP3, hopr.fm, and Overview, as applicable to your show. PodSEO remembers your selected view, so use the source bar if Analytics opens somewhere different from a guide's screenshot.
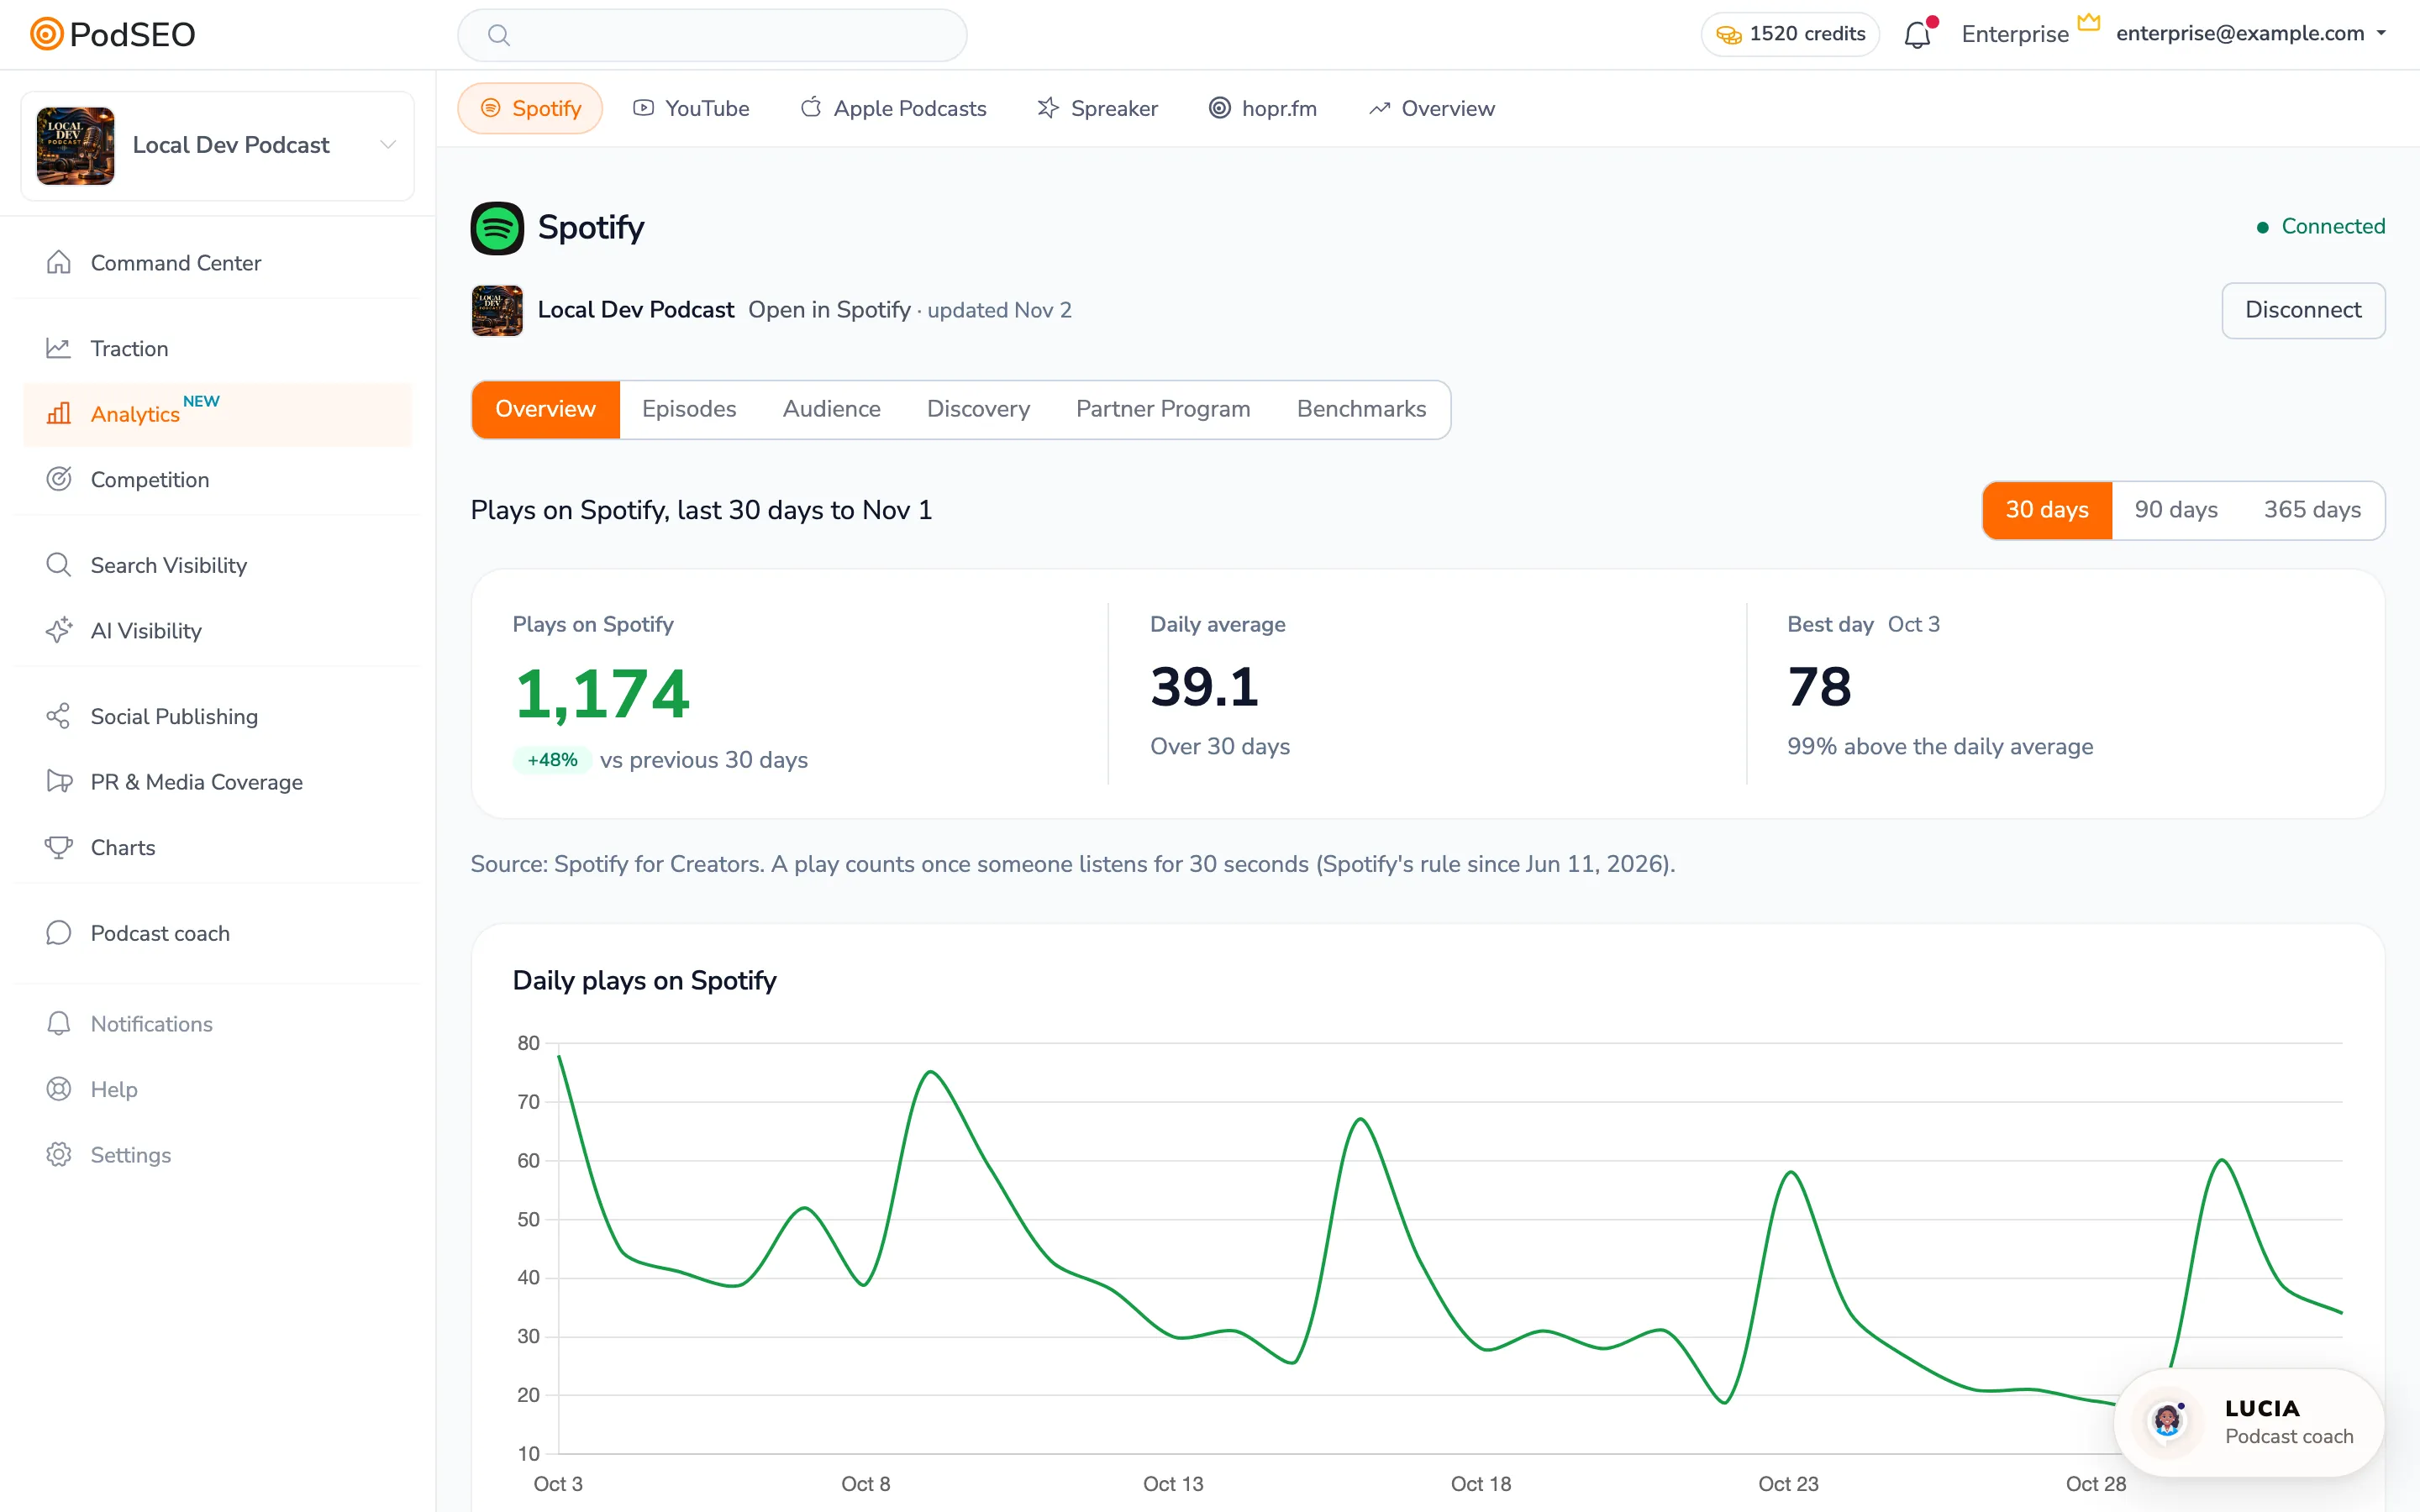
Connect first, then choose a report
If a source is not connected, its tab shows the relevant setup steps. Follow Analytics Connections for Spotify, Apple Podcasts, YouTube, supported hosts, OP3, and hopr.fm. Manage existing accounts from Settings → Connections.
Connections are available on every plan. YouTube has a limited Free view; organization roles determine who can connect or change access.
Source-by-source guides
Use the dedicated guides for the actual reports and episode details, rather than treating setup as a walkthrough of the whole source:
- Spotify analytics: discovery, episode reports, listening retention, audience, benchmarks and Partner Program.
- Apple Podcasts analytics: plays, followers, episode launches, listening curves and Apple's reporting windows.
- Hosting platform analytics: Spreaker/Buzzsprout/Simplecast/Captivate/Transistor downloads, episode comparisons and audience reports.
- hopr.fm analytics: counted/excluded requests, day and reason investigation, launches and download timing.
- OP3 data: the Analytics Tracker source, complete launch windows and unavailable counts.
- YouTube analytics: viewing, discovery, episode/video matches and channel reports.
Navigate within a source
Connected sources have a second row of views. The exact options depend on what that platform reports:
| View | What to look for |
|---|---|
| Overview | Headline metrics and daily trends for this source |
| Episodes | Episode performance, launch comparisons, and available episode details |
| Audience | Geography, demographics, apps, or devices, depending on the source |
| Discovery | How people find the show or channel, including Spotify impressions and YouTube search terms |
| Benchmarks, Partner Program, Podcast playlists, or More | Additional reports when the source provides them |
Source dates matter. A report with no data, a withheld value, or an incomplete day isn't a zero. Read the reporting window and any coverage or connection warning before comparing periods.
Compare listening with changes to your show
Choose the Overview tab at the end of the source bar, then Timeline. It puts each connected source alongside releases, metadata changes, and other recorded events.
- Separate keeps each source on its own scale.
- Overlay places the lines together to compare their timing; the numbers are still separate measurements.
- Hover a day to read its values and events.
- Where available, choose This show or Whole channel for YouTube. A channel with several shows can have more views than the playlist for this podcast.
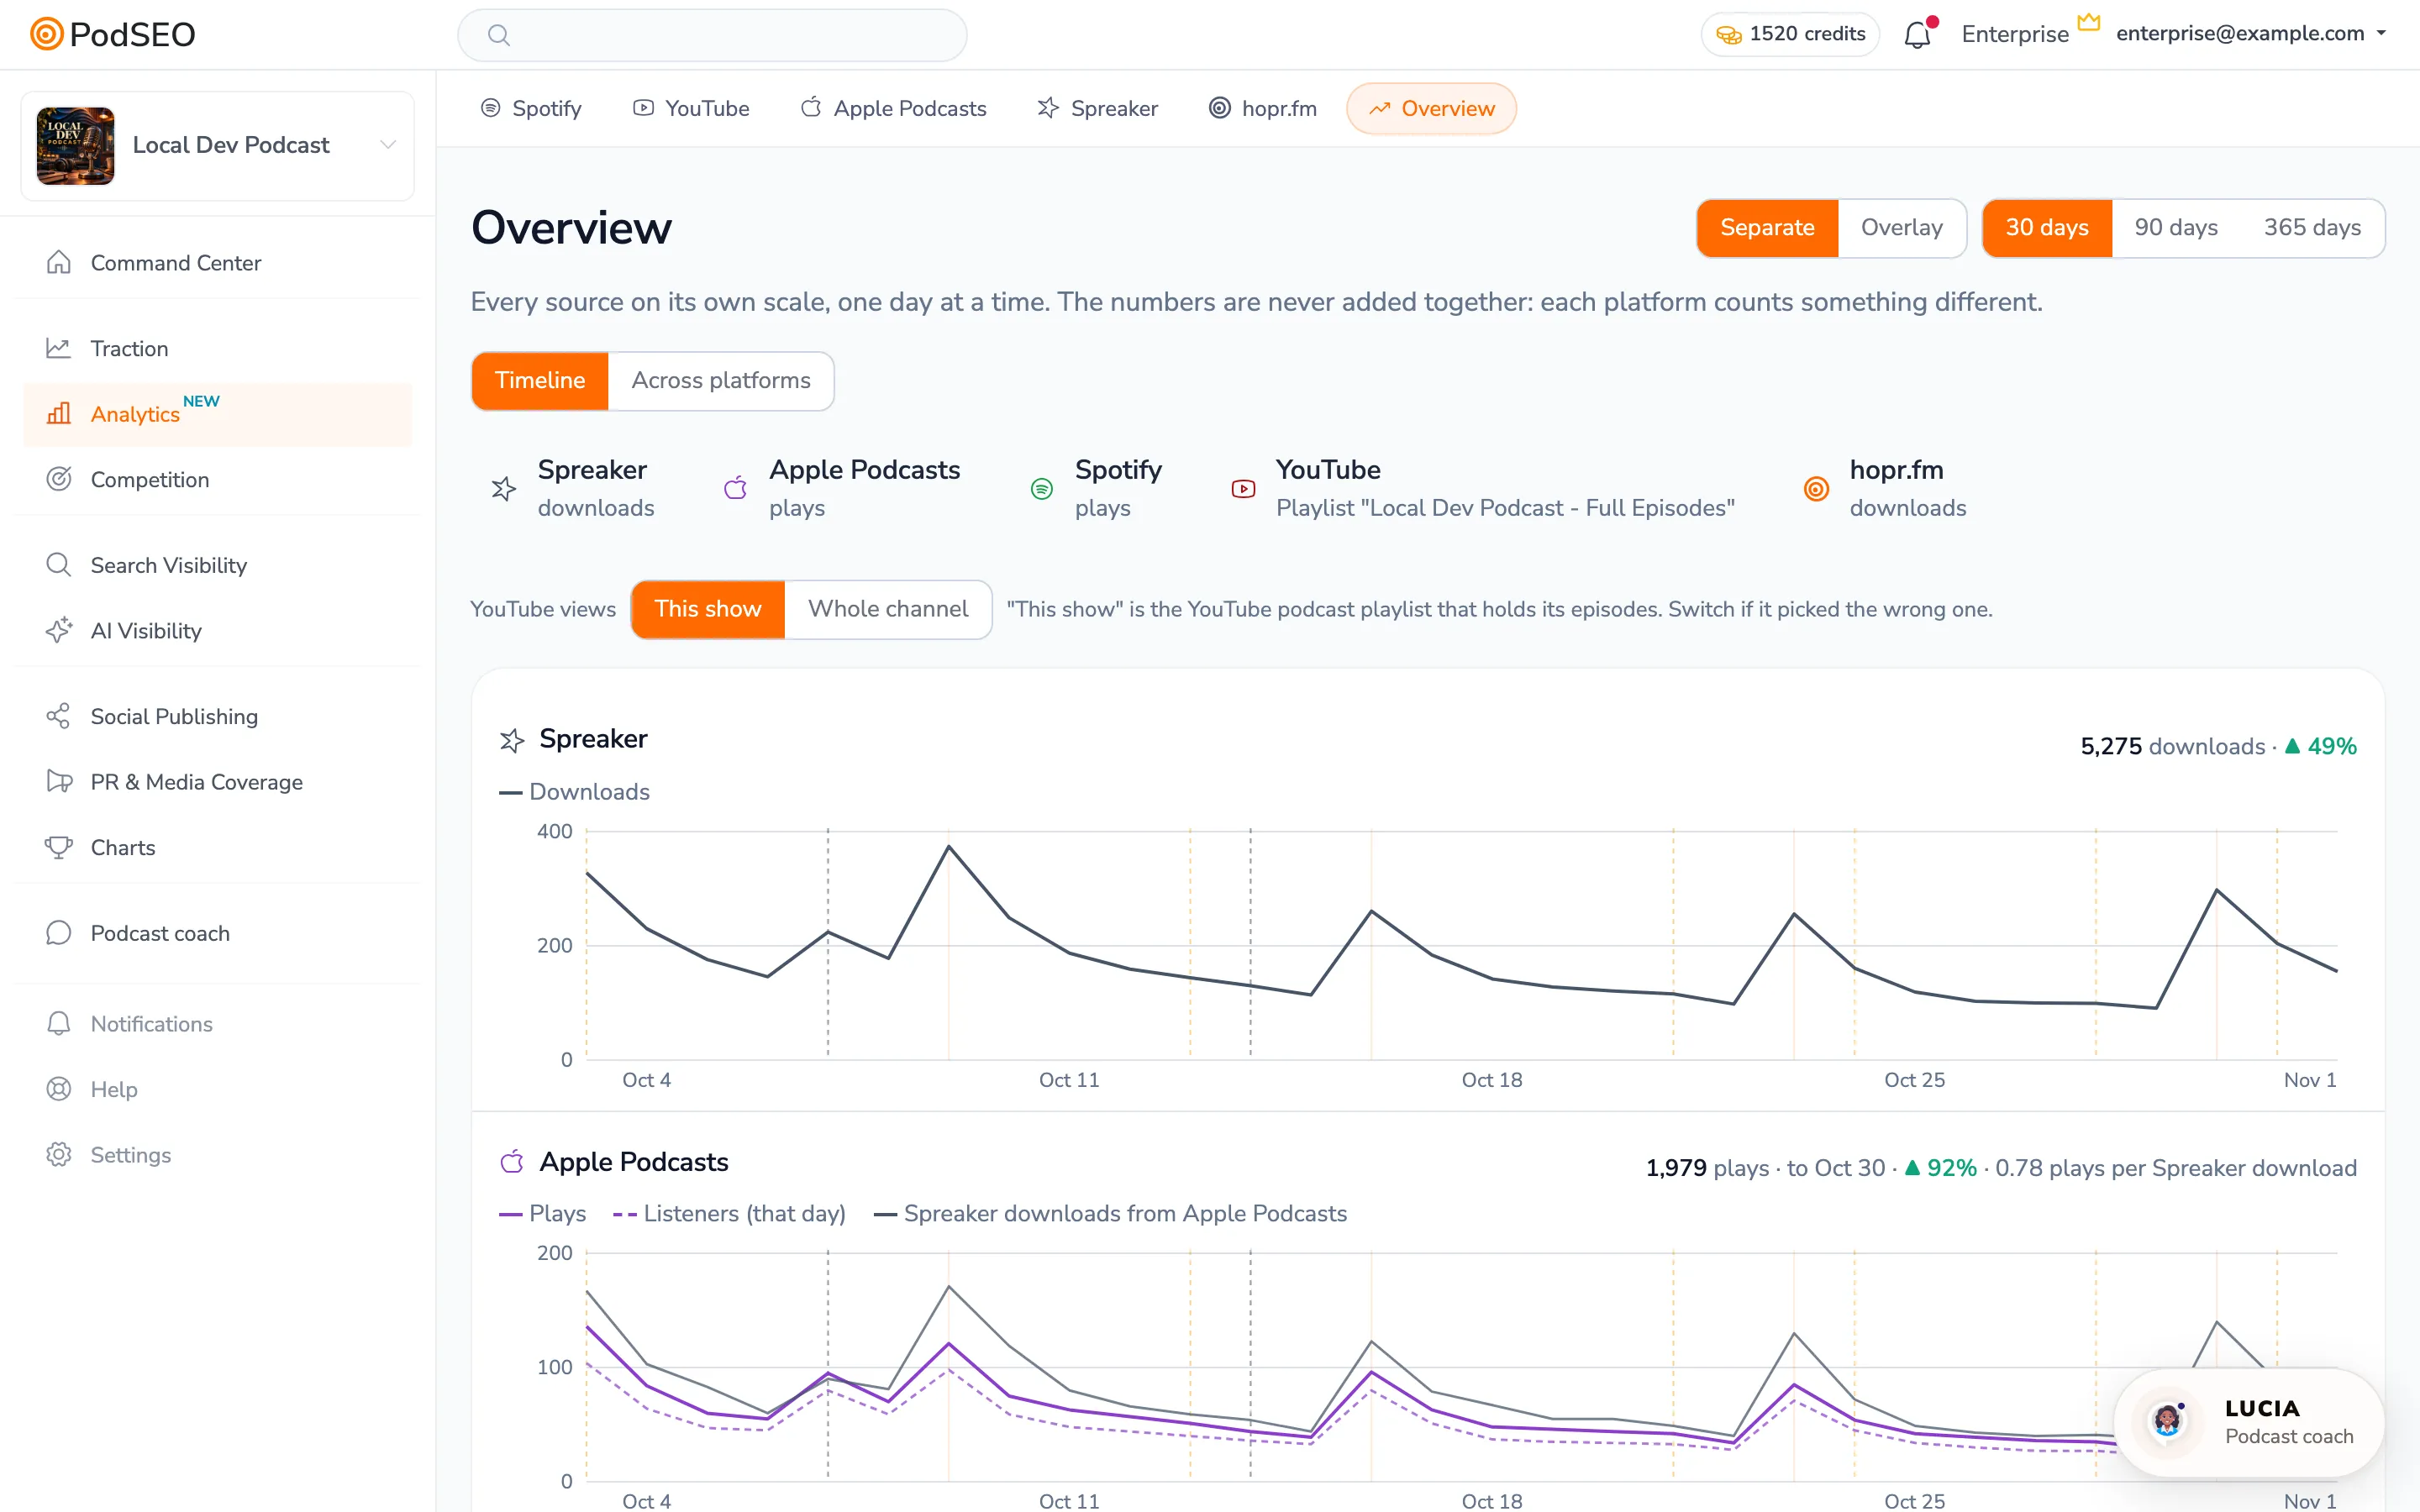
To follow the demonstration, open Overview → Timeline, switch to Overlay to compare timing, then return to Separate to read each source on its own scale. This changes the presentation, not the measurements.
An increase after a title change is a useful lead to investigate, not proof that the change caused it.
Compare the same episode across platforms
In the source bar's Overview, choose Across platforms to open the Episode explorer. Select an episode and compare the measurements available from your connected sources. Keep views, plays, downloads, and listening curves in their own context.
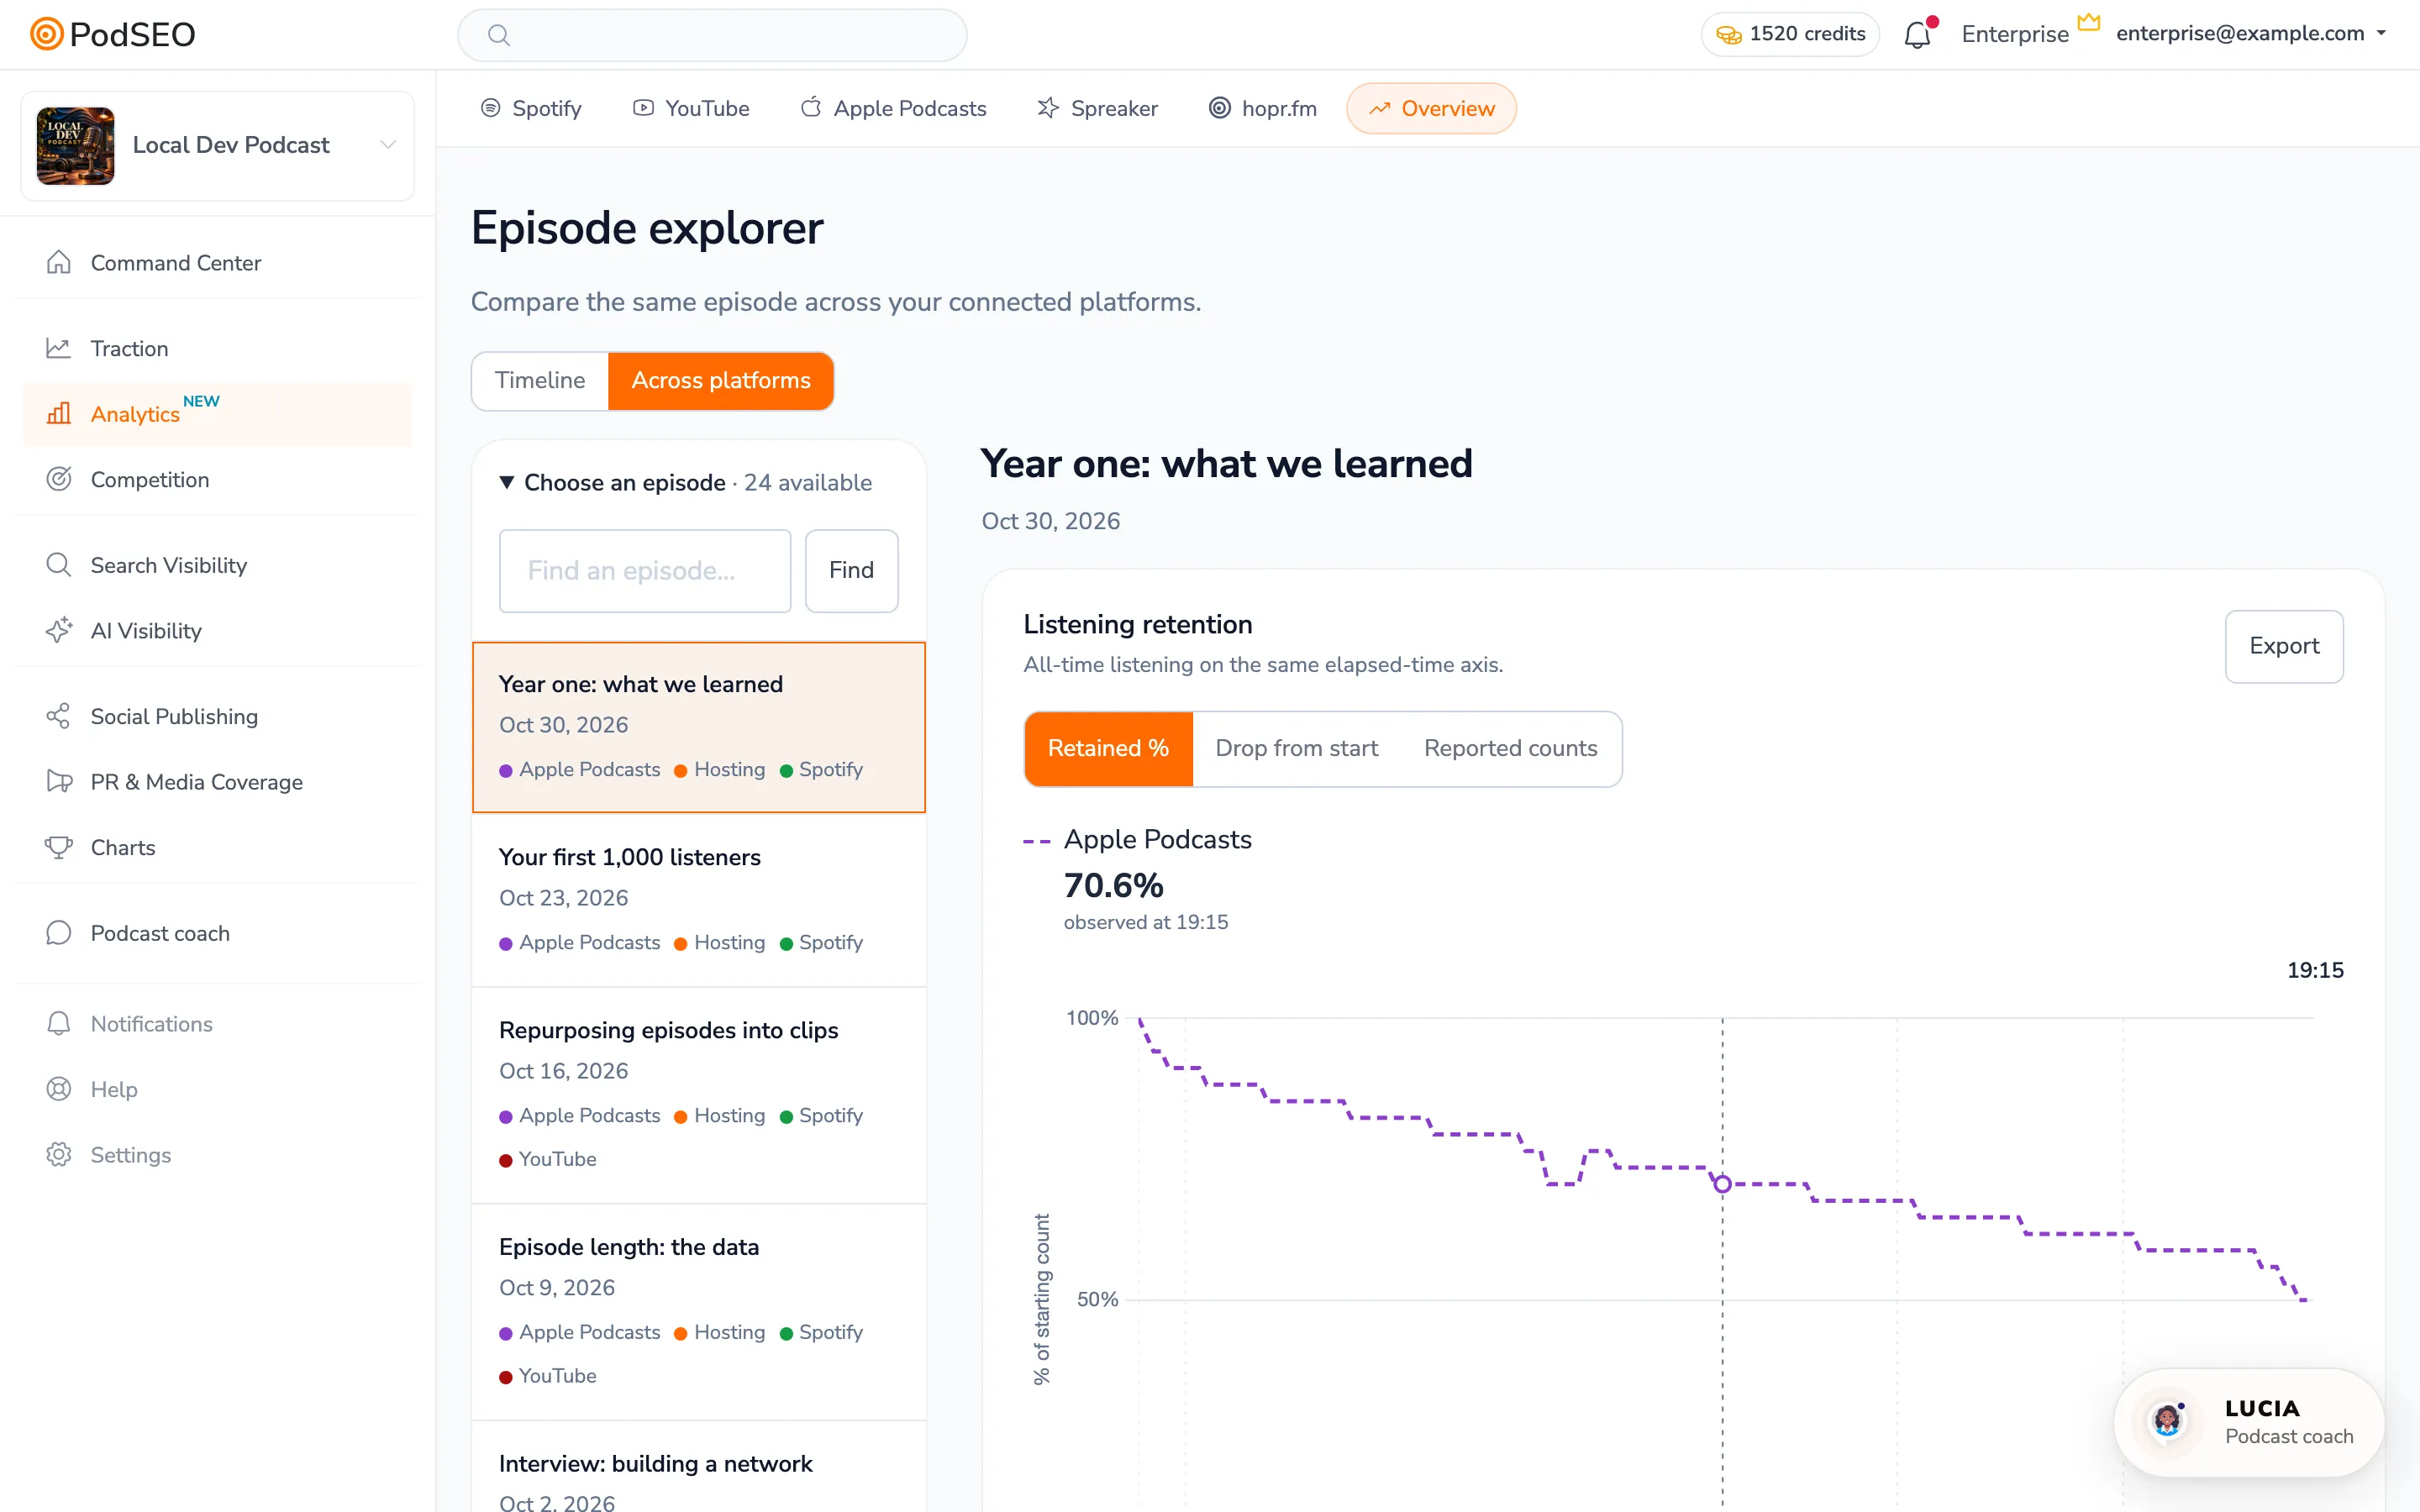
For source-specific episode details, use Episodes inside that source. For video matching and title suggestions, use YouTube analytics.
Compare listening curves and select a passage
In Overview → Across platforms, choose an episode from the list. Use Find an episode… to locate another title. The available source badges show where measurements exist; not every episode has every curve. YouTube measurements appear for confirmed full-episode matches.
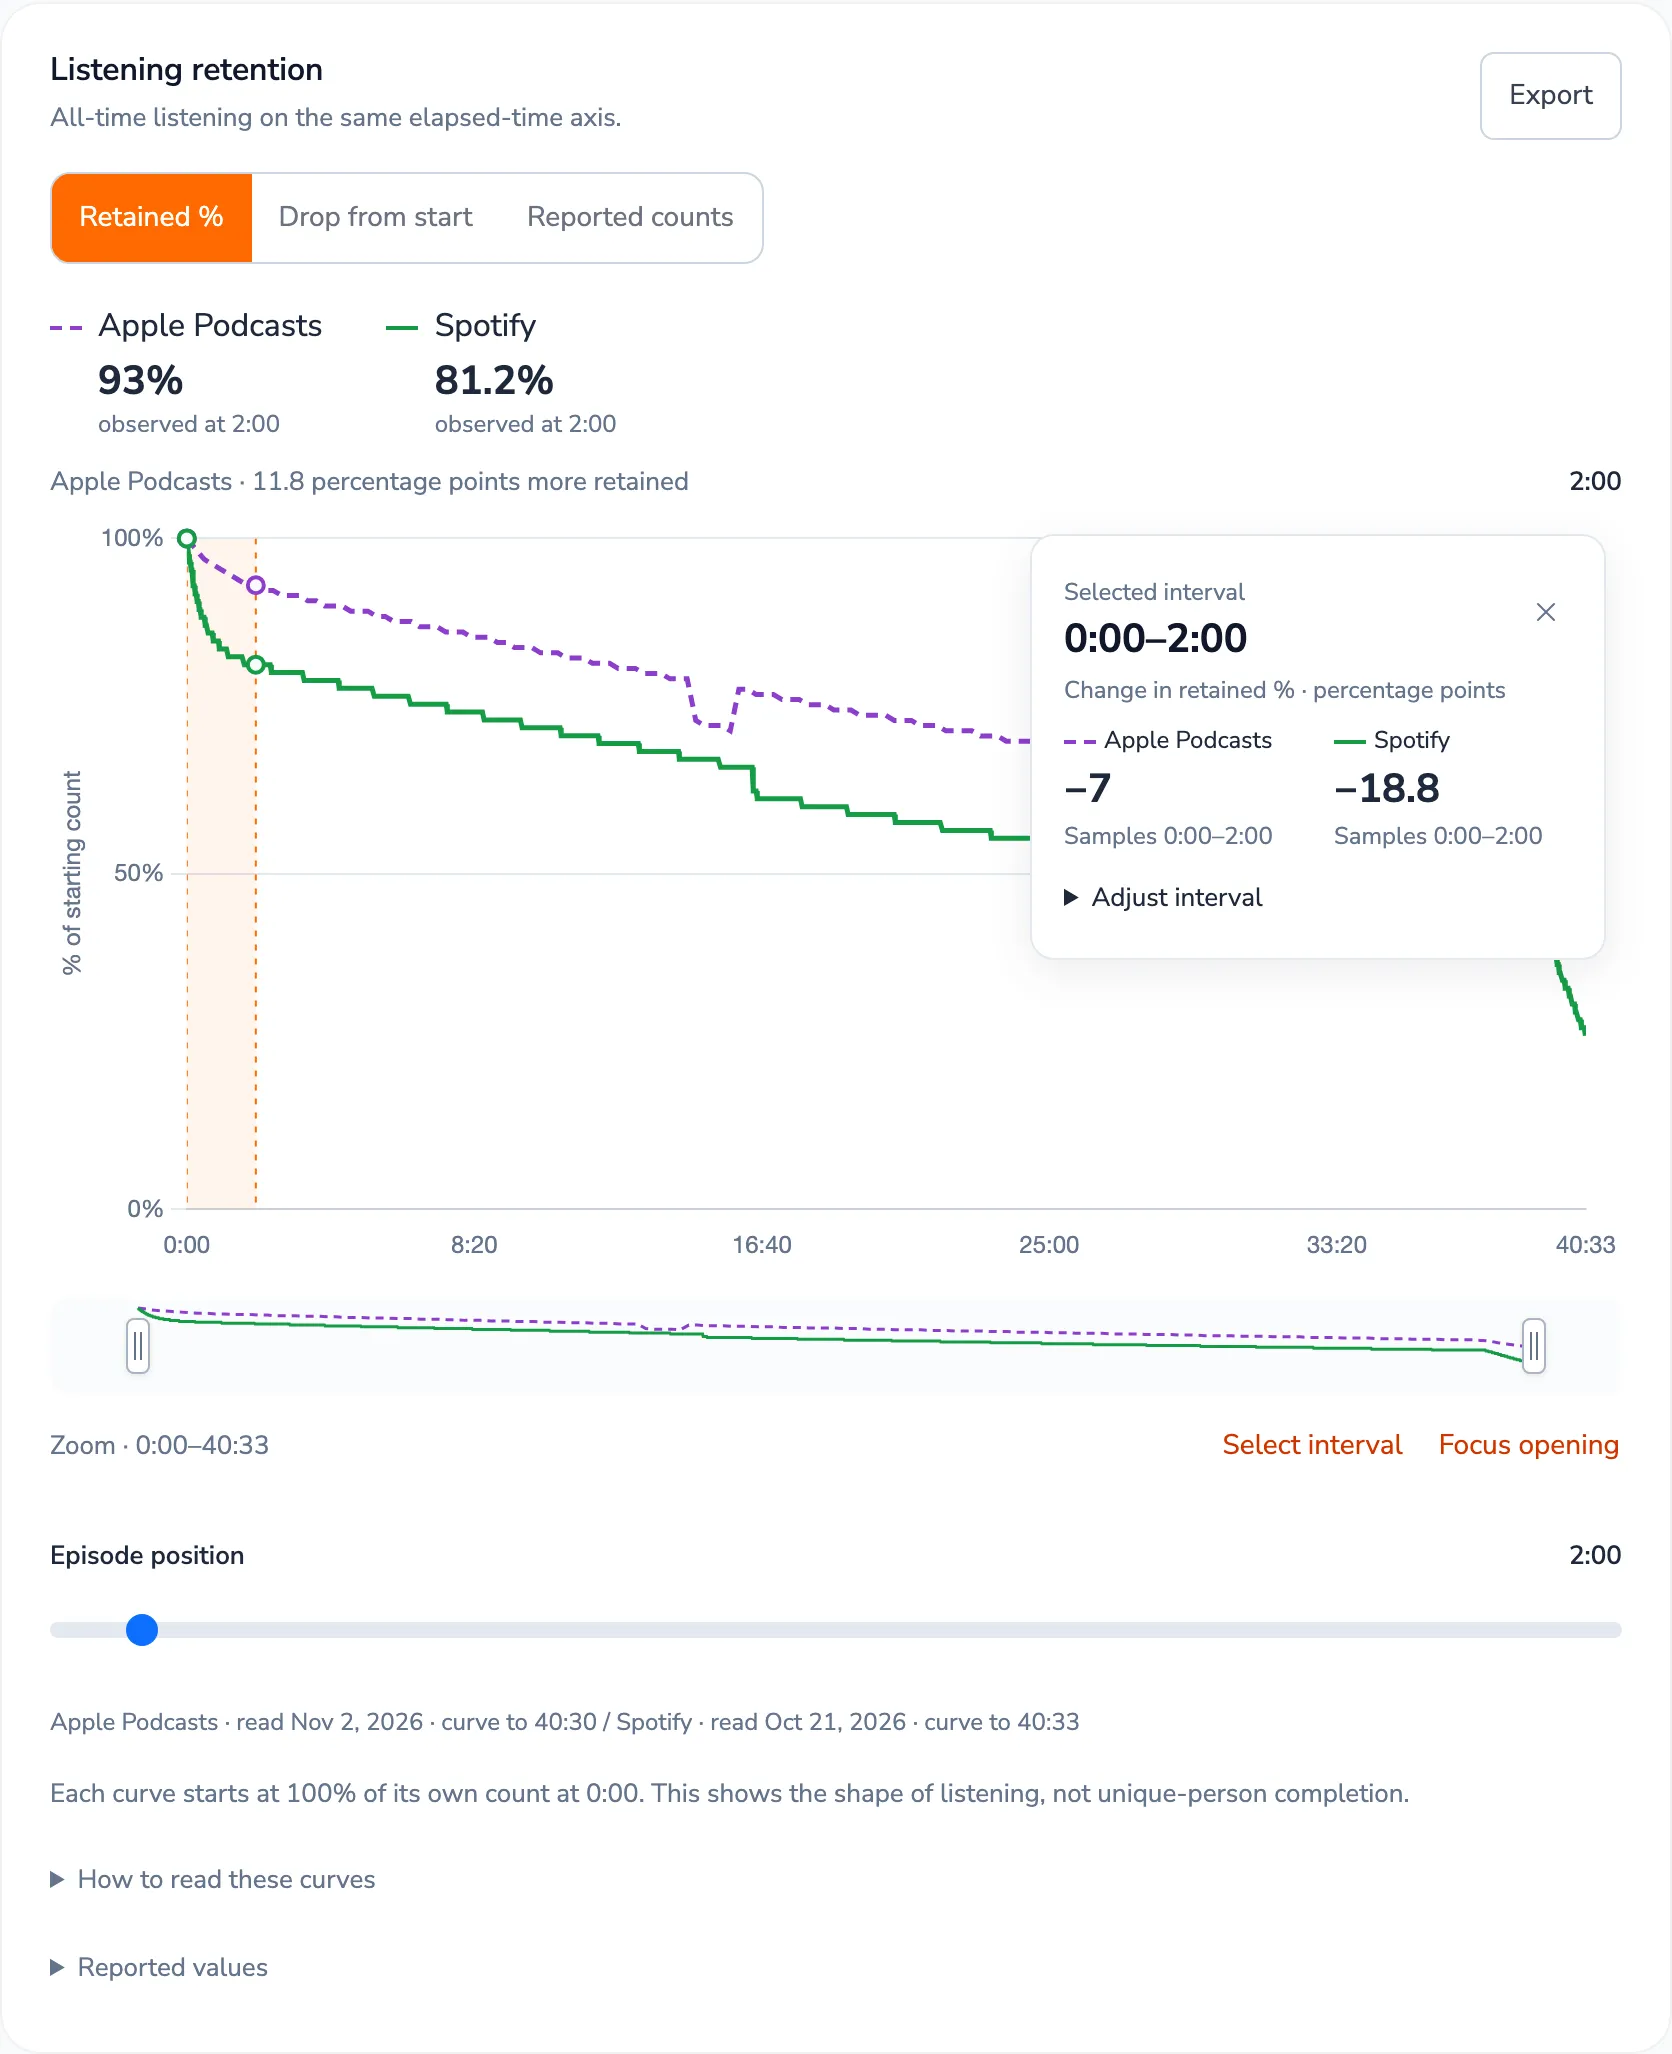
The Listening retention chart aligns the available Apple and Spotify curves by elapsed time:
- Retained % sets each source's own count at 0:00 to 100%, so you can compare the shape of listening.
- Drop from start shows 100 minus that percentage. It is not a count of people who abandoned the episode.
- Reported counts shows the source observations. These are not a combined audience.
Skipping, replaying and different methods affect the curves: values can exceed 100%, drops can be negative, and percentage comparison is unavailable without a valid starting count. Different edits or ads may shift the same passage between platforms.
Zoom into the opening or a selected interval
- Click Focus opening to zoom into the beginning. Full episode restores the full range.
- Choose Select interval, enter From and To as minutes and seconds, then Apply. You can also drag horizontally over the main chart.
- Read Selected interval for the source values in that passage. Adjust interval changes its times; the close button clears it.
- Use the lower navigator to change the visible range. The navigator supports dragging and keyboard controls. Episode position explores one point; it is different from selecting an interval.
Chapter buttons, when available, select Spotify's reported passages; check the note about different edits before comparing with Apple. Reported values and Export CSV expose the underlying observations.
Below the curves, each source's episode card retains its unit, measurement window, read date and available match information. Use Open … reports for the complete source detail. The episode over time compares available daily plays/downloads using its date control; gaps remain unavailable and counts stay separate.
Common questions
Why don't my totals match? Platforms count different actions, cover different audiences, and report at different times. A hosting download is not the same as an Apple listener or a YouTube view.
Where do I change a connection? Open Settings → Connections, filter by show, and expand the provider. Setup and reporting links return you to the relevant source.
Where are my search positions? Use Search Visibility → Rankings for positions and Tracker for their history. Analytics shows the listening and viewing data available from connected platforms.