
Spotify analytics
Spotify analytics connects discovery with listening: how often your show is seen, which episodes get plays, who returns, and how listeners move through an episode. Keep Spotify's own measurements and date windows separate from host downloads and Apple listening.
To access: choose your podcast → Analytics → Spotify. Follow Connect Spotify if reports are not connected yet.
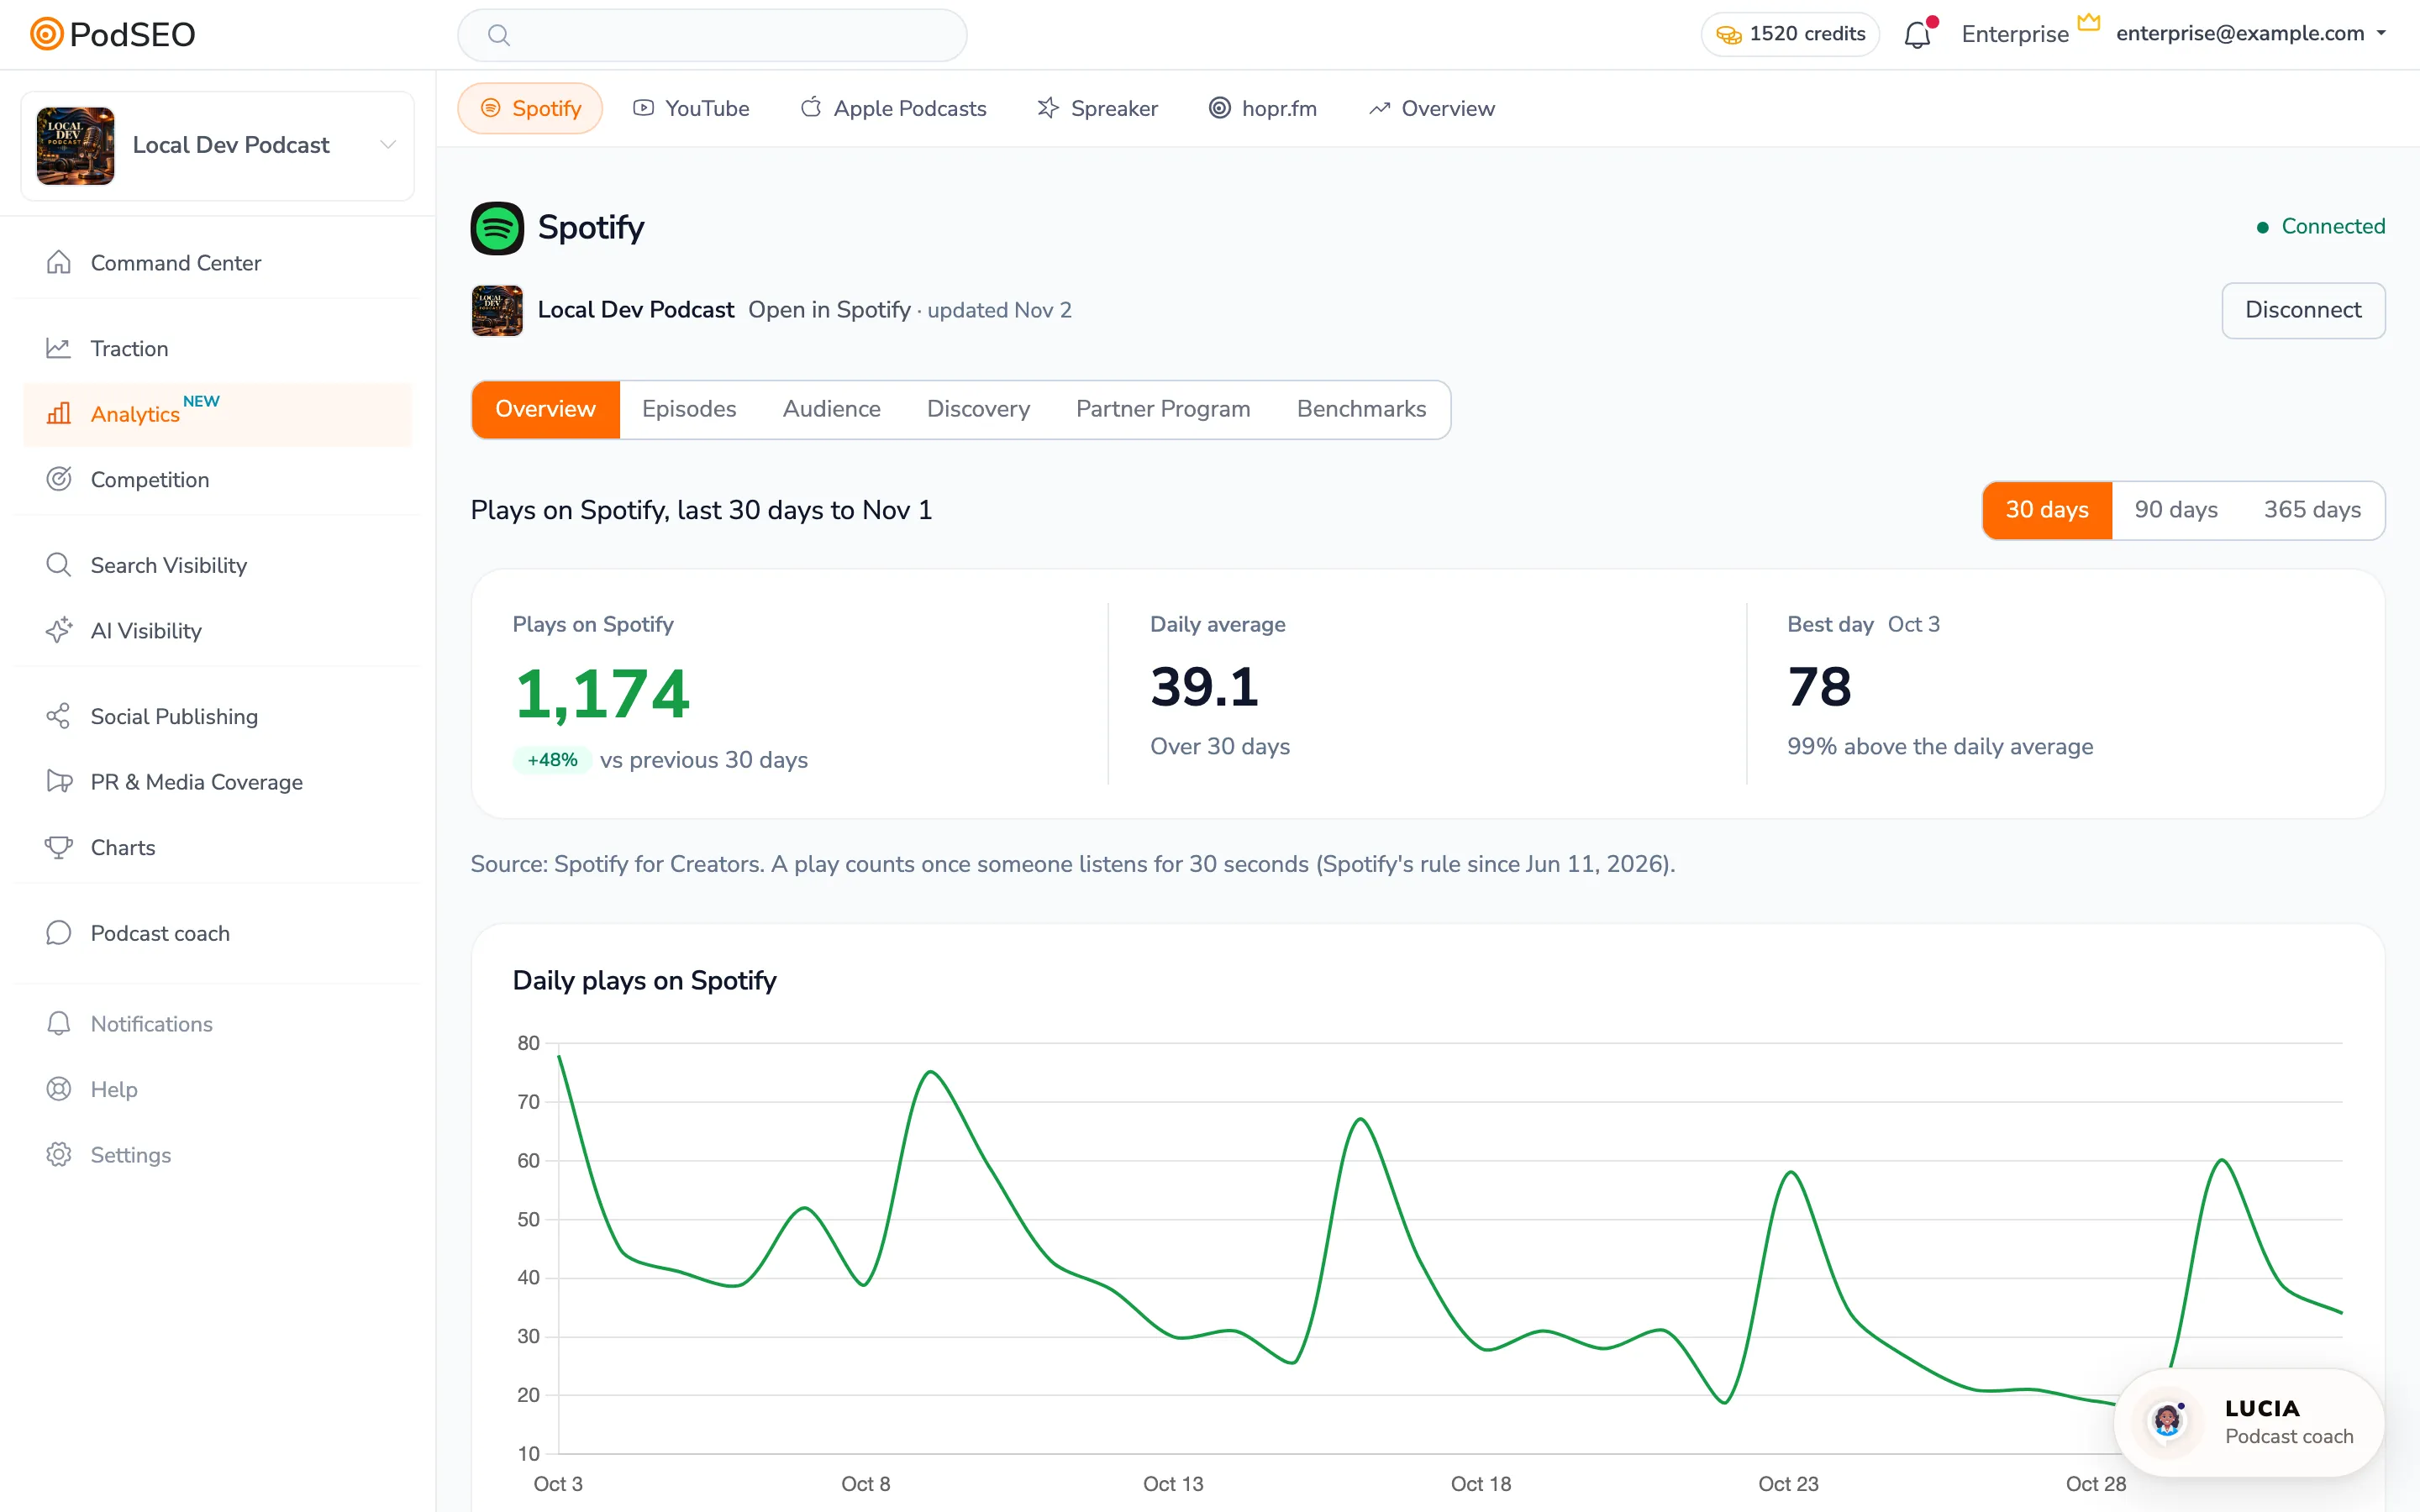
Start with Overview
The 30, 90 and 365 days selector changes the plays period. The daily chart, daily average and best day help you spot changes within it. Unique listeners, last 30 days and Listening & audience retain their own dates: follower growth, listening hours, new listeners and returning listeners may have different windows.
When Spotify hosts your show, additional On Spotify and Everywhere else measurements can appear. Someone who listens in both places may appear in both listener counts. Do not add those counts to estimate unique people.
In historical reports such as Listening & engagement, select the metric you want, open Reported values, or choose Export CSV. Who comes back is weekly audience retention across the show; it is not the completion rate of one episode.
Find and compare episodes
Open Episodes, enter part of a title in Find an episode…, choose a sort order, then click Apply. Sort options include impressions, plays, newest first, completion and title. Use the page controls for more episodes.
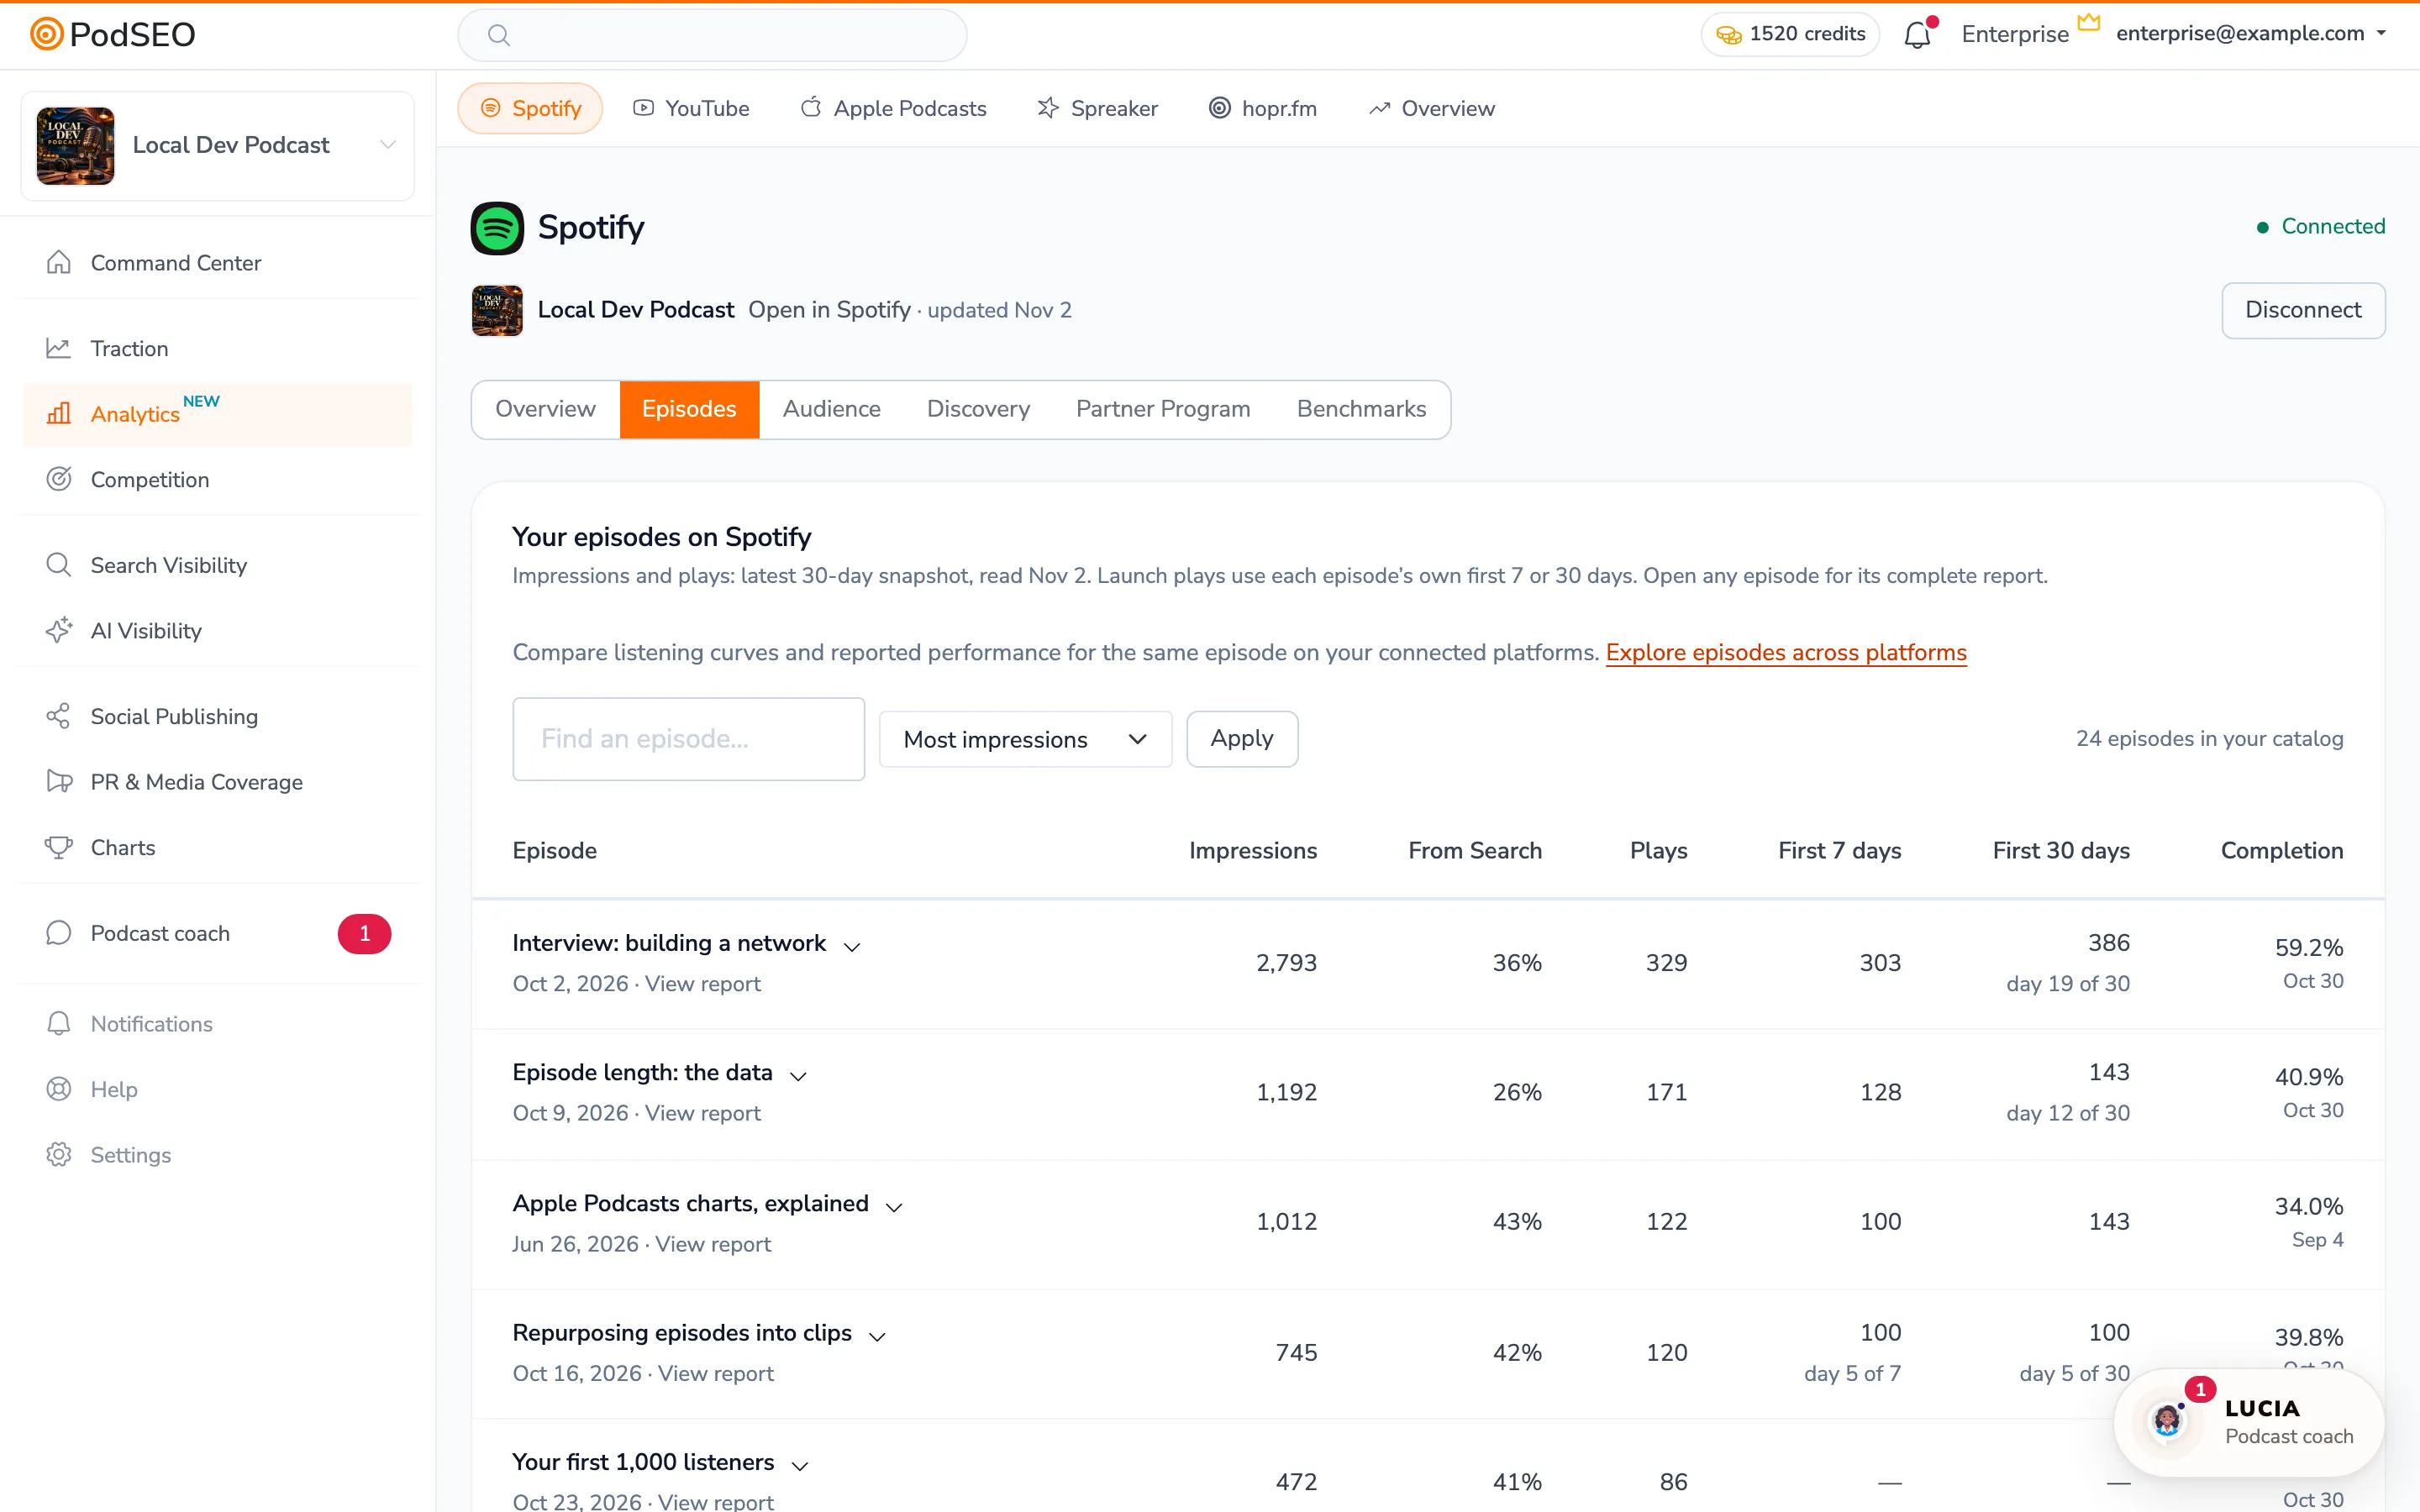
The table's impressions, From Search and plays describe the latest reported 30-day snapshot. First 7 days and First 30 days describe each episode's launch. They are different windows; check progress labels before comparing a new episode with a completed launch.
Completion is Spotify's reported completion measurement, not a value calculated by dividing the plays and impressions shown beside it.
Explore an episode in detail
Click its title to open the report underneath the row. Depending on what Spotify supplies, it can include:
- Listening retention along the episode, with listening milestones where available.
- The first 30 days, showing the available launch-day history.
- Performance by window, with a metric selector for plays, listeners, impressions, hours, completion or other reported measures. Each window is independent.
- Launch totals & discovery sources, with Search, Home, Library and Other where reported.
- This episode's audience, plus expandable audience breakdowns.
- How Spotify describes this episode, containing reported topics, transcript keywords, guests and chapters.
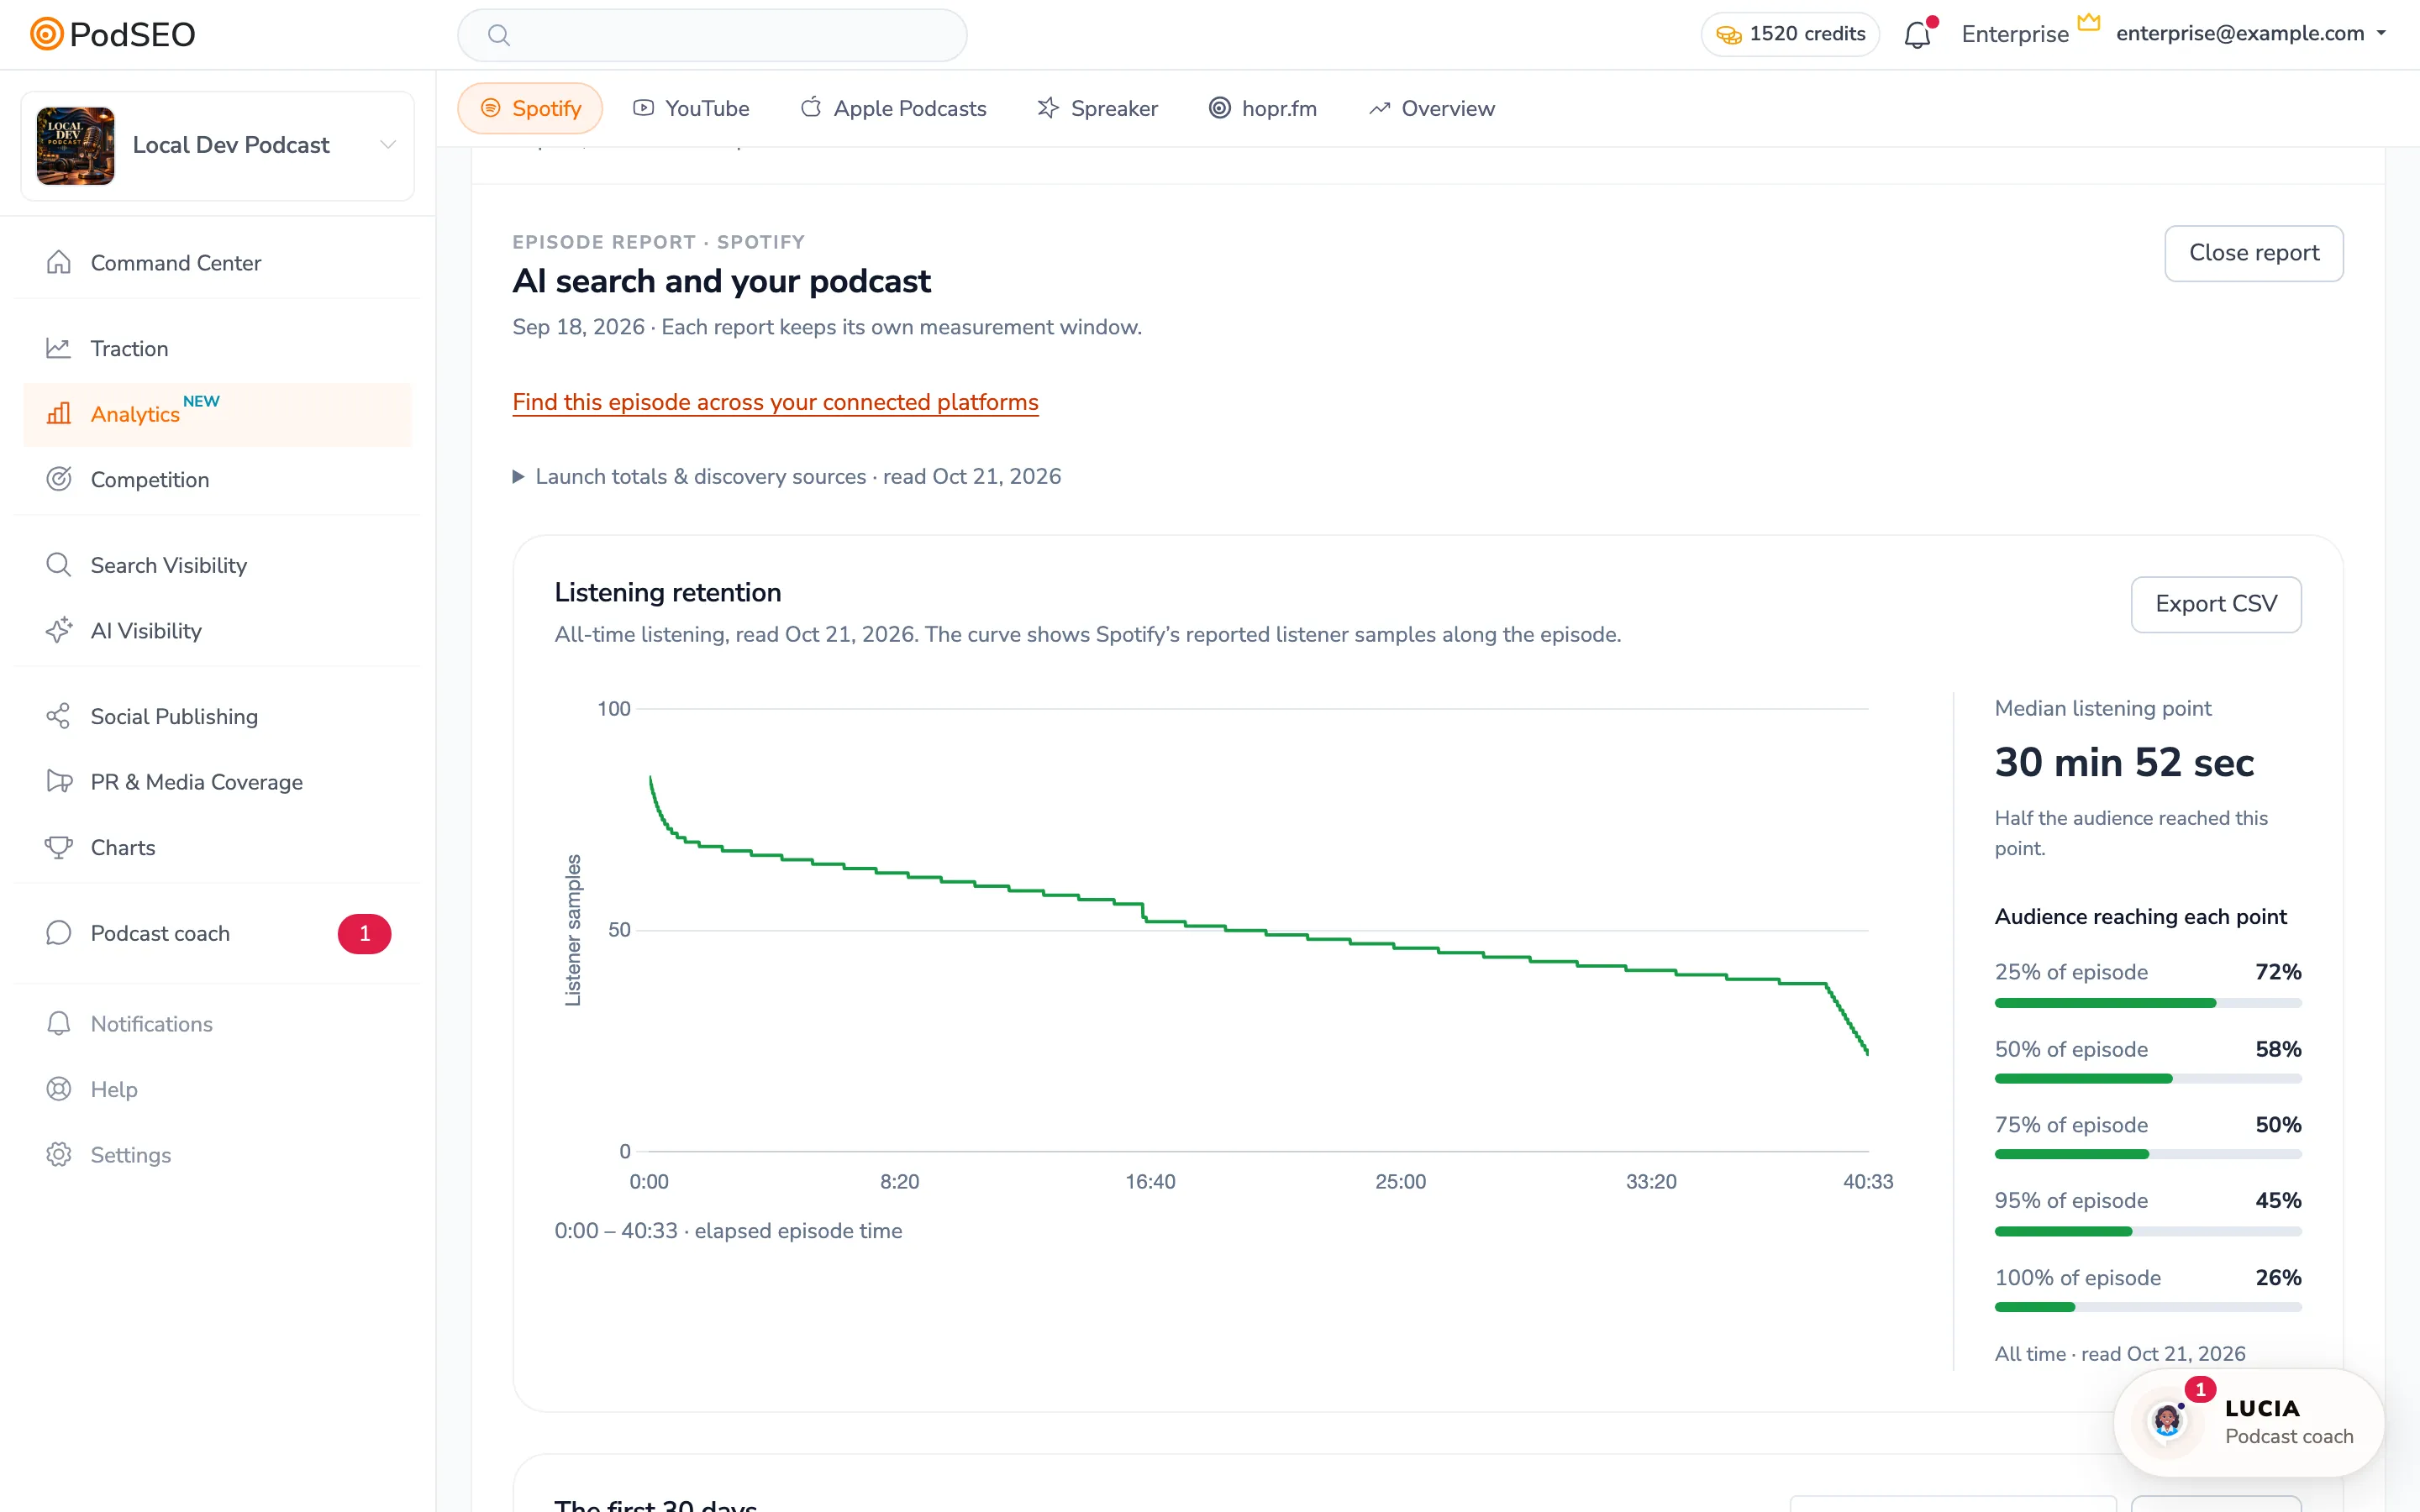
Missing reports remain explicitly unavailable; not every episode has every breakdown. Reported values exposes the exact measurements and Export CSV exports that report. Do not add unique listeners across launch windows or daily snapshots.
Choose Find this episode across your connected platforms to compare listening curves with Apple or read the other sources' episode measurements. Analytics explains the shared timeline and interval controls.
Read Audience and Discovery
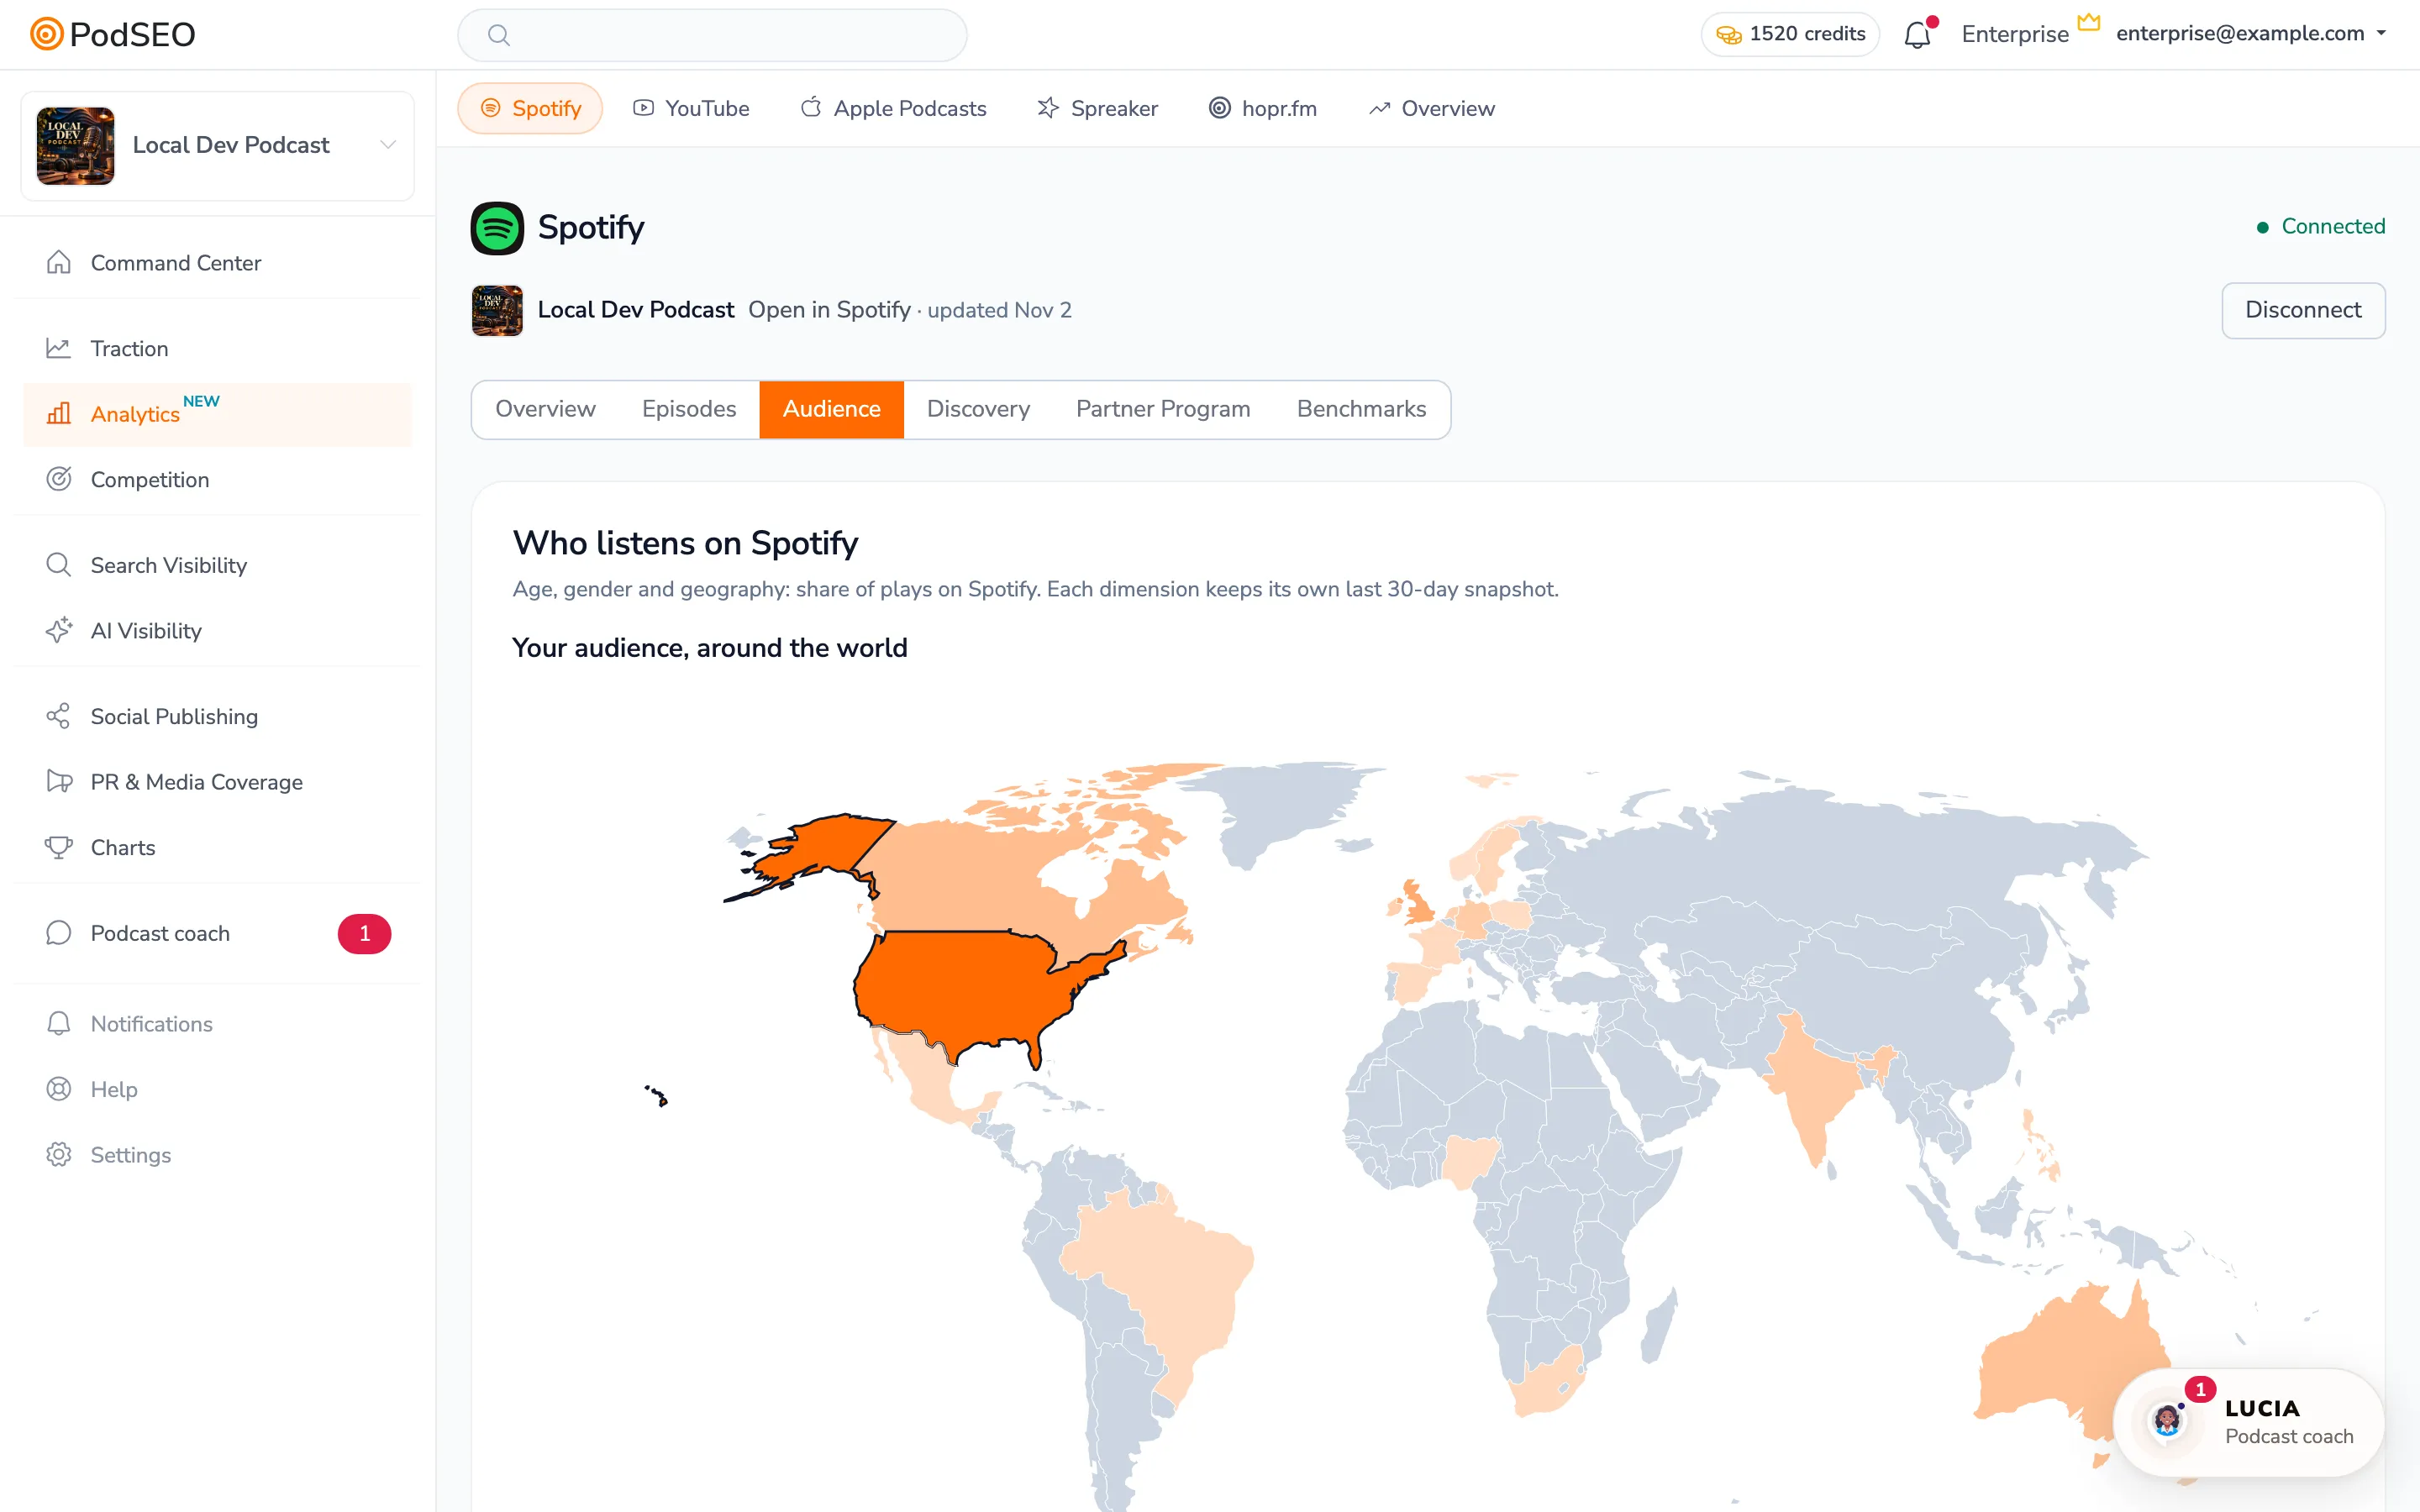
Audience includes country maps, age/gender, apps and devices where reported. Expand Regions and cities for more detail. Where a country map is available, expand All reported countries and select a country to highlight it and read its reported share. Each dimension keeps its own date and window; a list can cover only the locations Spotify reports.
Discovery shows impressions and sources such as Search, Home and Library, plus the available impression-to-play funnel and history. An impression means Spotify showed your show; it is not an audio play or a unique listener. Funnel steps keep their own dates, so do not derive a new conversion rate from unrelated windows.
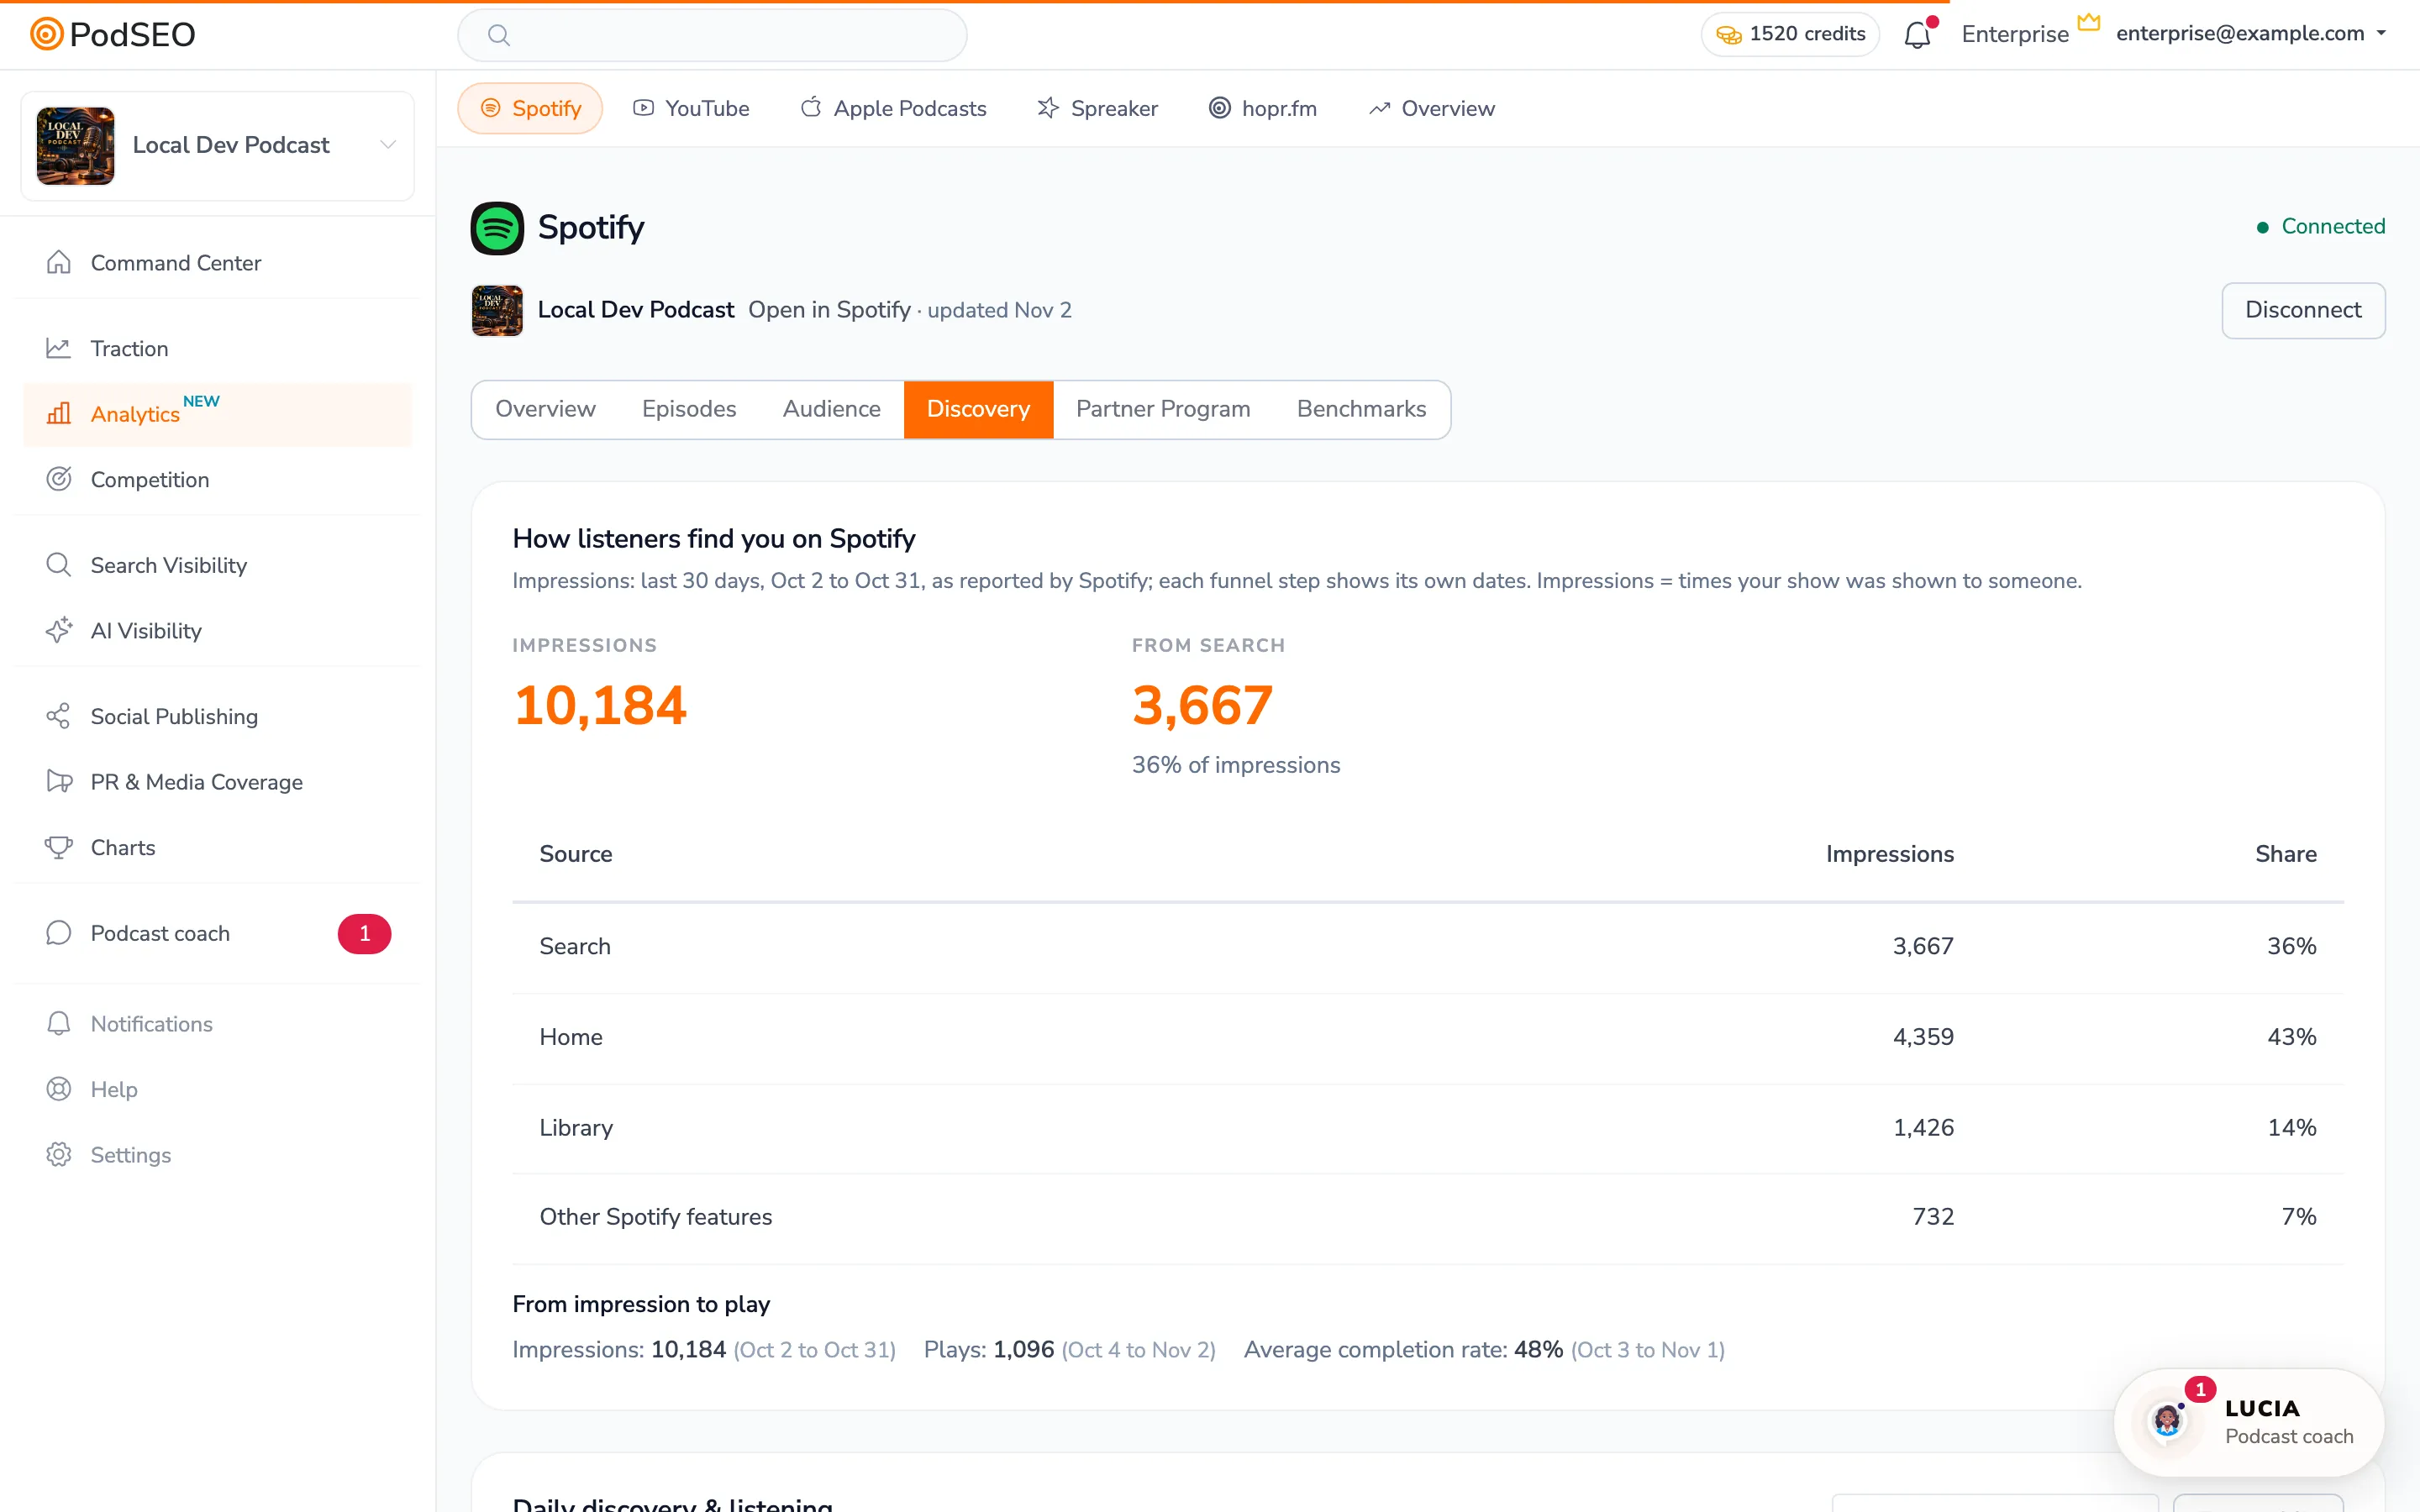
Spotify's Search bucket can include charts and editorial recommendations. It is not a list of exact search queries. Episode topics and transcript keywords describe content; they do not prove which words a listener typed. Use Strategy and Rankings for your tracked search work.
Benchmarks and Partner Program
Benchmarks shows Spotify's comparable-show percentiles where available. These describe the comparison group, not your own score. Expand a benchmark to inspect the chart and its reported values. All reported show measurements lists observations with their windows and read dates; different windows are separate measurements.
Partner Program shows Spotify's reported progress toward its application thresholds and links to its current criteria. Reaching the displayed thresholds allows an application; it does not guarantee acceptance. Read the hosting and country notes and check the program in Spotify for Creators.
When a report looks incomplete
Check the connection state and each report's date first. Connected does not mean every report is already available. A missing value is not zero, and a retained snapshot is not a new measurement. Use Connections for access changes and Analytics Connections for setup or reconnection.
For a regular review, compare an episode's discovery, plays and listening curve using the labelled windows. Treat a change after a new title or release as a lead to investigate, not proof of cause.