
Apple Podcasts analytics
Use Apple Podcasts analytics to understand plays, listening time, followers and how people move through individual episodes. These measurements describe listening on Apple Podcasts; they are not your show's downloads across every app.
To access: choose your podcast → Analytics → Apple Podcasts. If you see connection steps instead of reports, follow Connect Apple Podcasts. You can read the reports on every PodSEO plan.
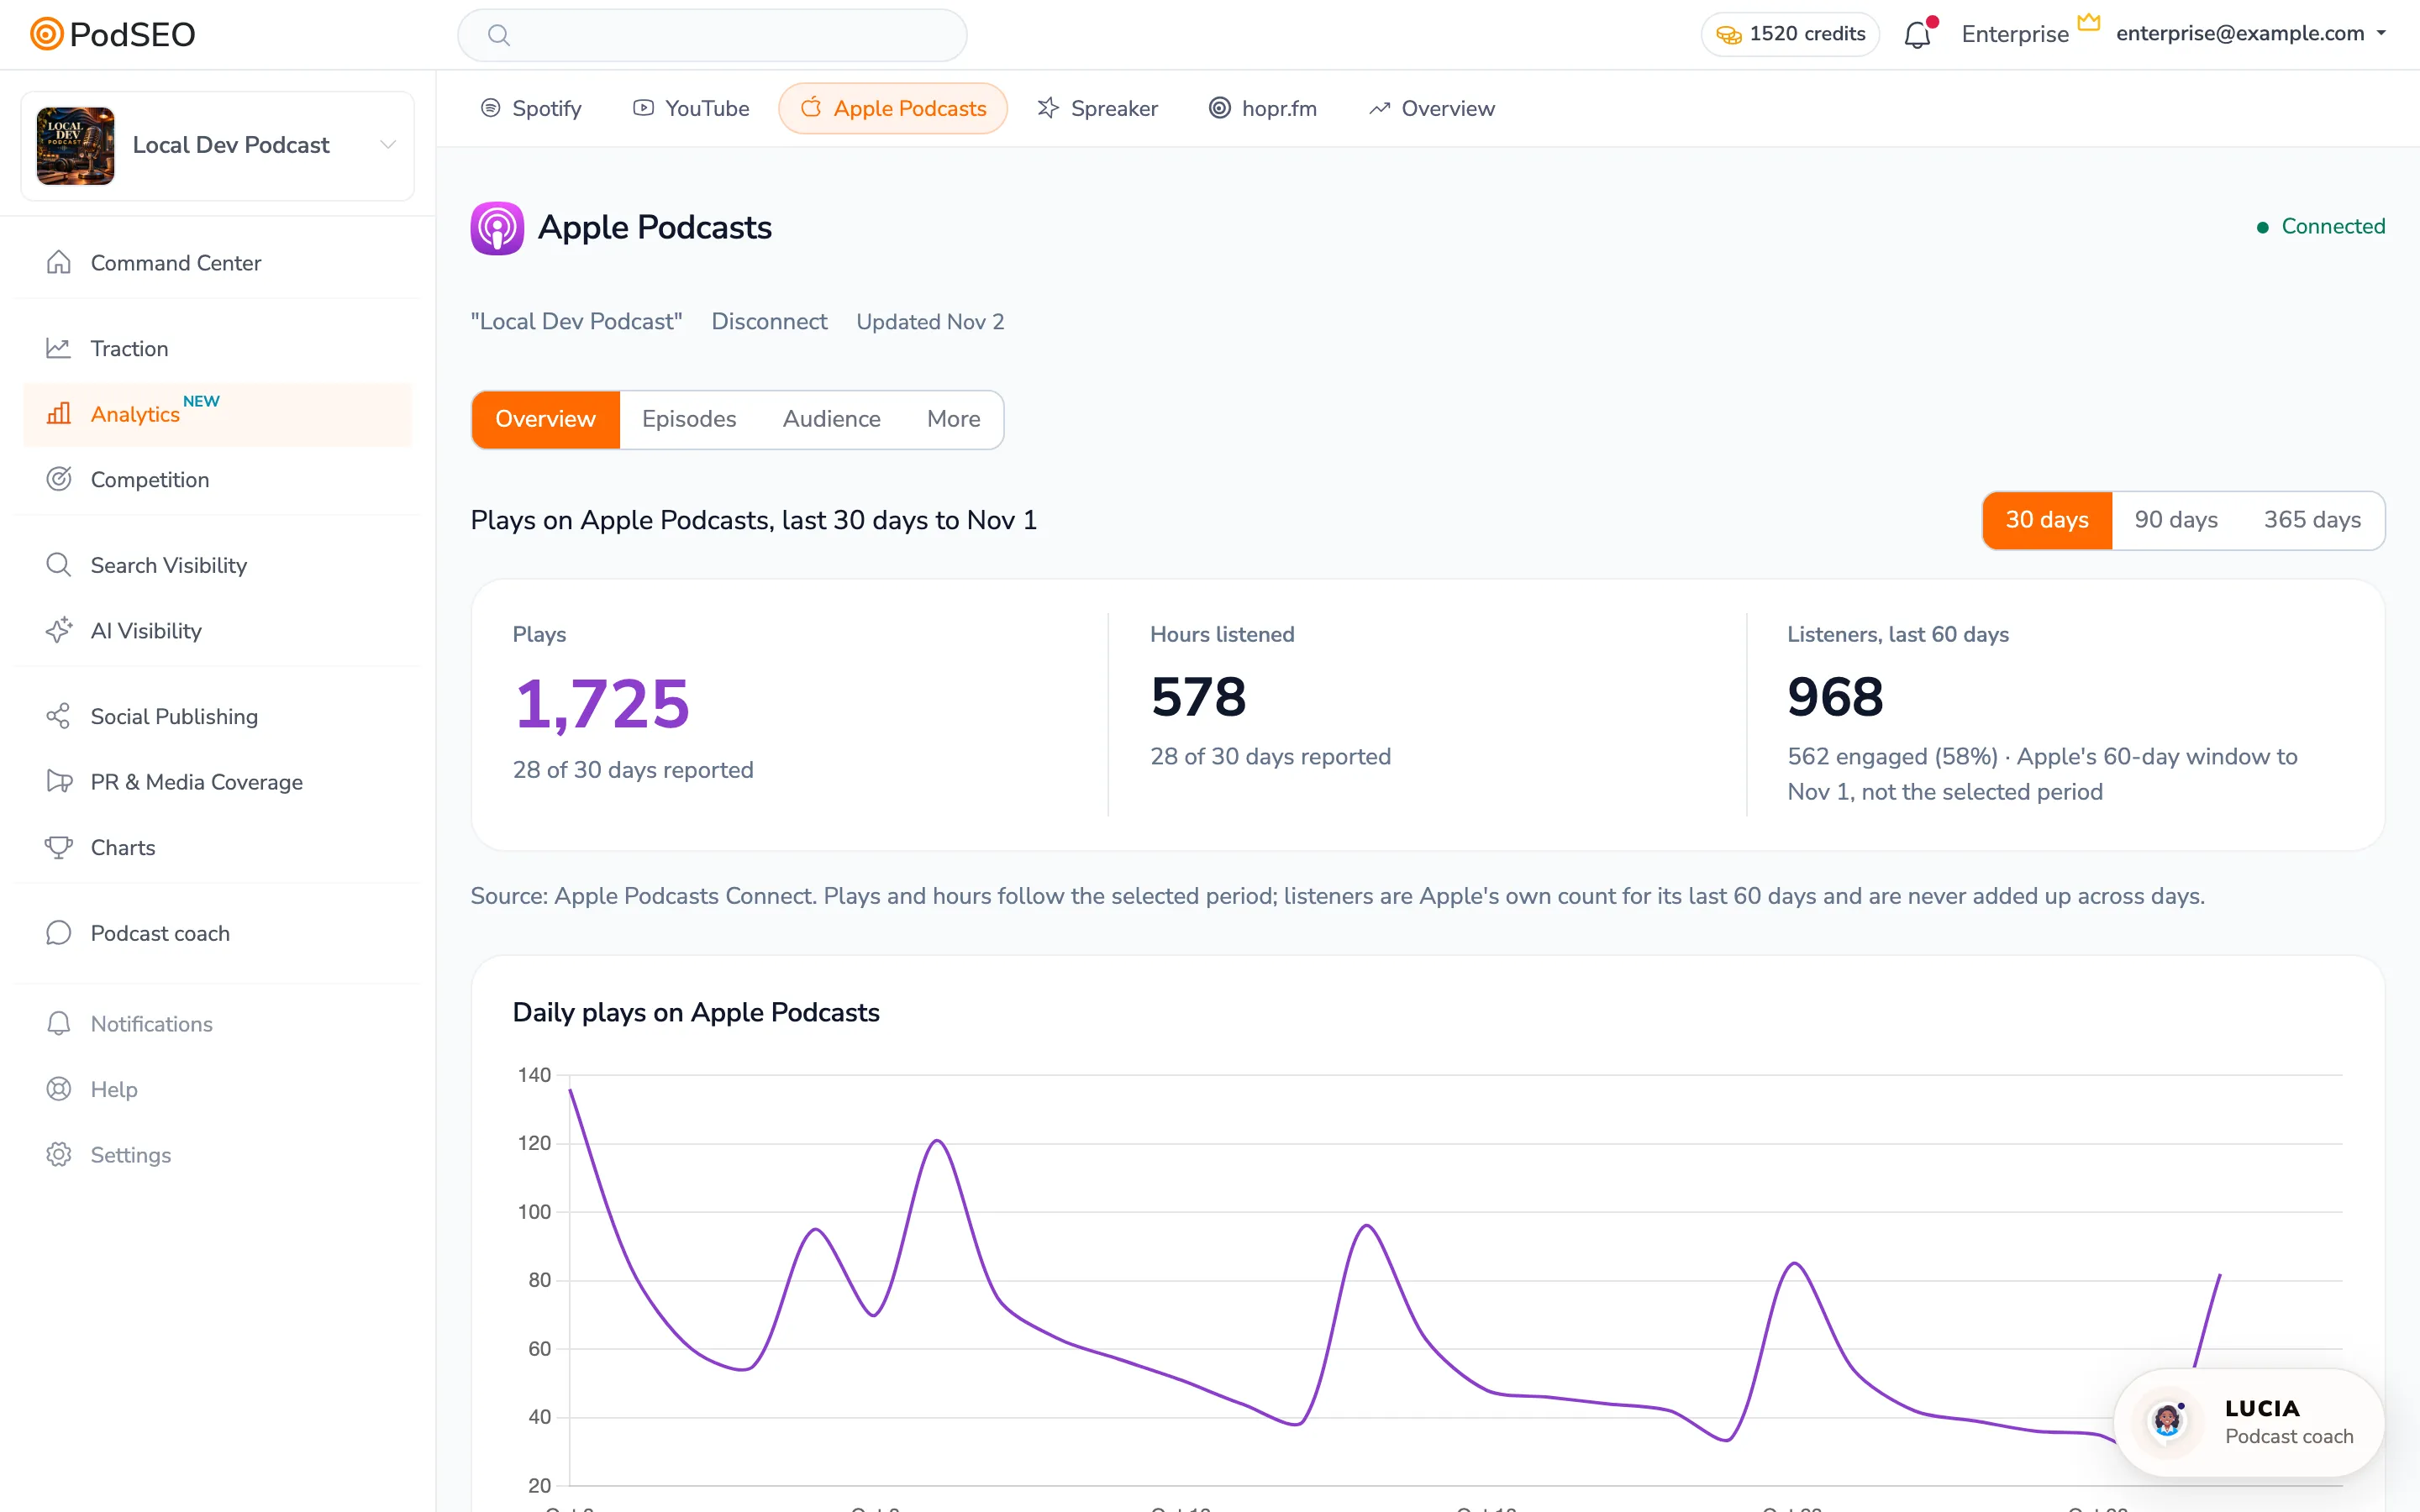
Read the Overview
The 30, 90 and 365 days selector changes plays, hours listened and the relevant follower period. It does not turn every card into a report for the same dates: Listeners, last 60 days keeps Apple's own window. Read each card's dates and the number of days reported.
- Plays counts episode playbacks, using Apple's measurement.
- Hours listened describes time spent listening.
- Listeners counts people within Apple's reporting window. Do not add daily or monthly listener counts: the same person can appear in several windows.
- Engaged listeners listened to at least 20 minutes or 40% of an episode.
The daily plays chart leaves gaps where Apple reported no measurement. Followers shows the total as of its stated date and the gained/lost figures for its period. Time listened: followers and everyone else compares shares of listening time, not shares of unique people.
Expand Month by month to see monthly plays, listeners, engaged listeners and hours, plus the available all-time totals. Those all-time figures cover Apple's records, not necessarily the entire life of your podcast.
Compare episode launches
Open Episodes. The table combines all-time episode measurements with separately labelled launch measurements:
| Column | How to use it |
|---|---|
| Plays, Listeners | All-time episode counts as of the stated read date |
| First 7 days / First 30 days | Plays from release day; a newer episode can show progress such as “day 3 of 7” |
| Launch, when available | Unique listeners over the displayed launch interval, compared with a typical episode at the same age |
| Engaged | Share of the episode's listeners who meet Apple's engagement definition |
| Avg. listened | Listening time per play as a share of the episode's duration; this differs from the engaged share |
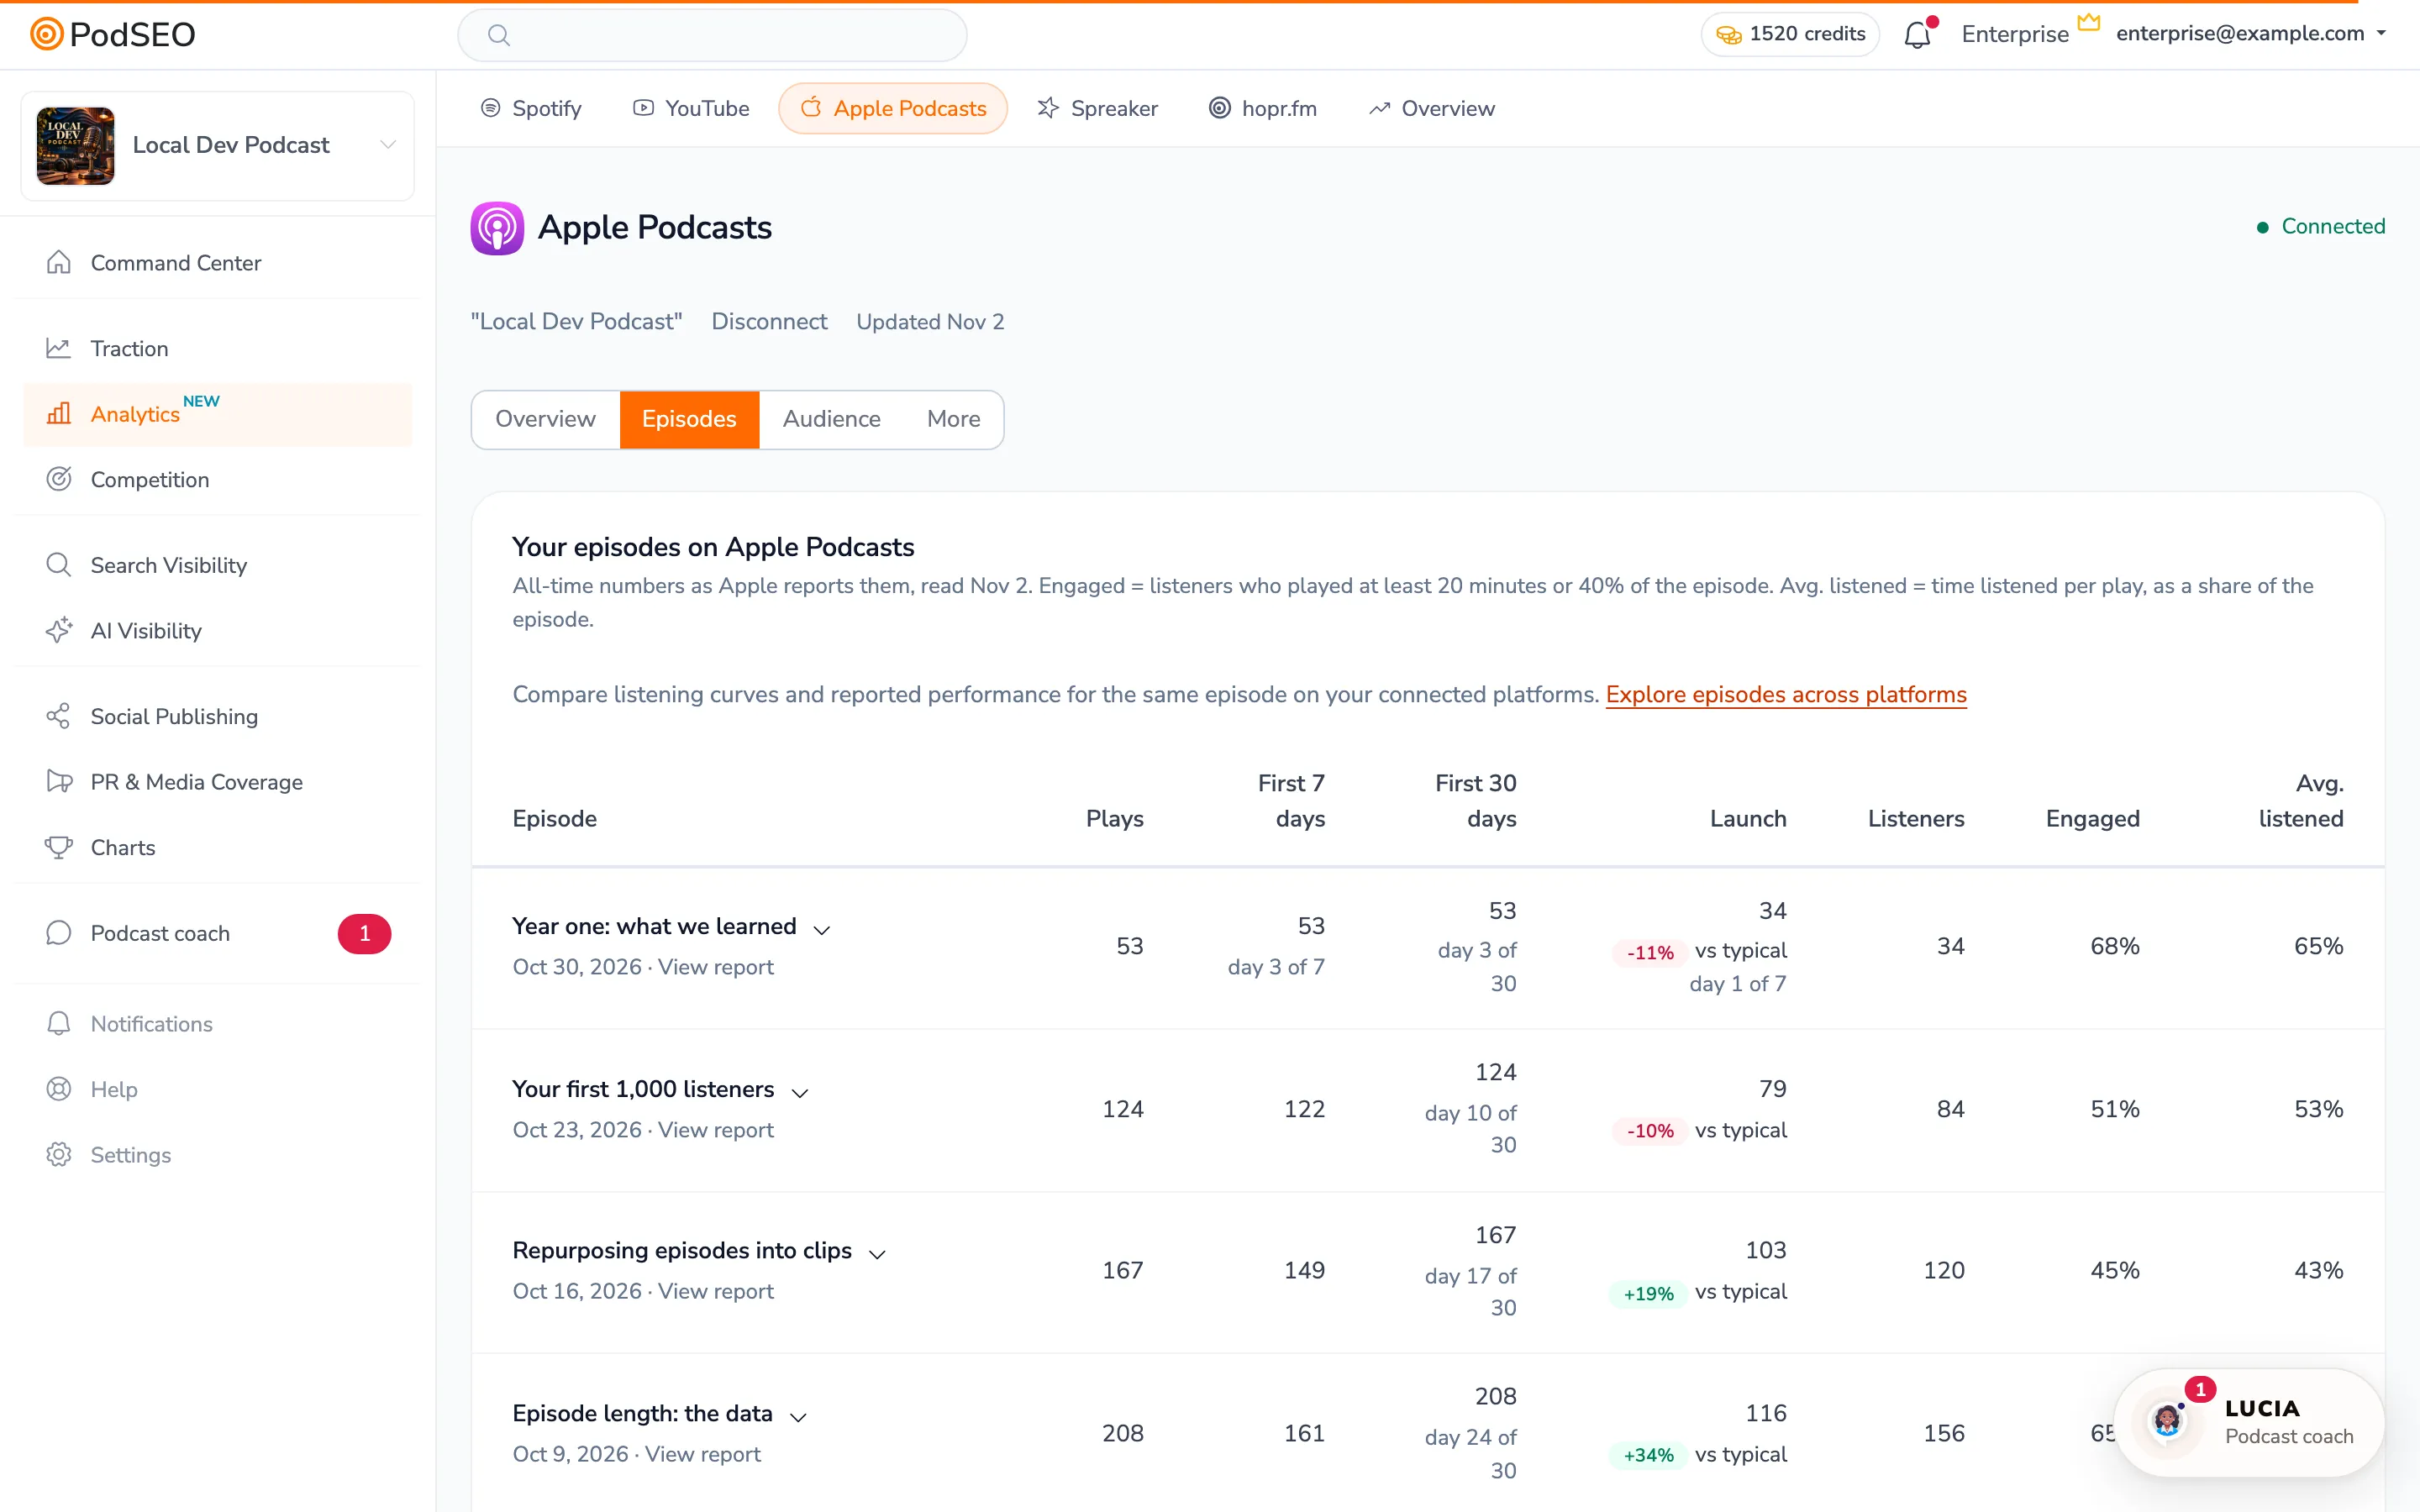
Compare complete first-week windows with complete first-week windows. The page explains where first-days coverage begins; an older episode can show “–” because its launch predates that coverage.
Open an episode's complete report
- In Episodes, click an episode title or View report.
- Read Inside the episode to see the listening curve along elapsed episode time.
- Use Daily listening to explore plays or listening time by date.
- Use How the episode has grown to inspect cumulative snapshots. Never add these snapshots together.
- Expand All episode measurements for the reported totals, or inspect the available country breakdown.
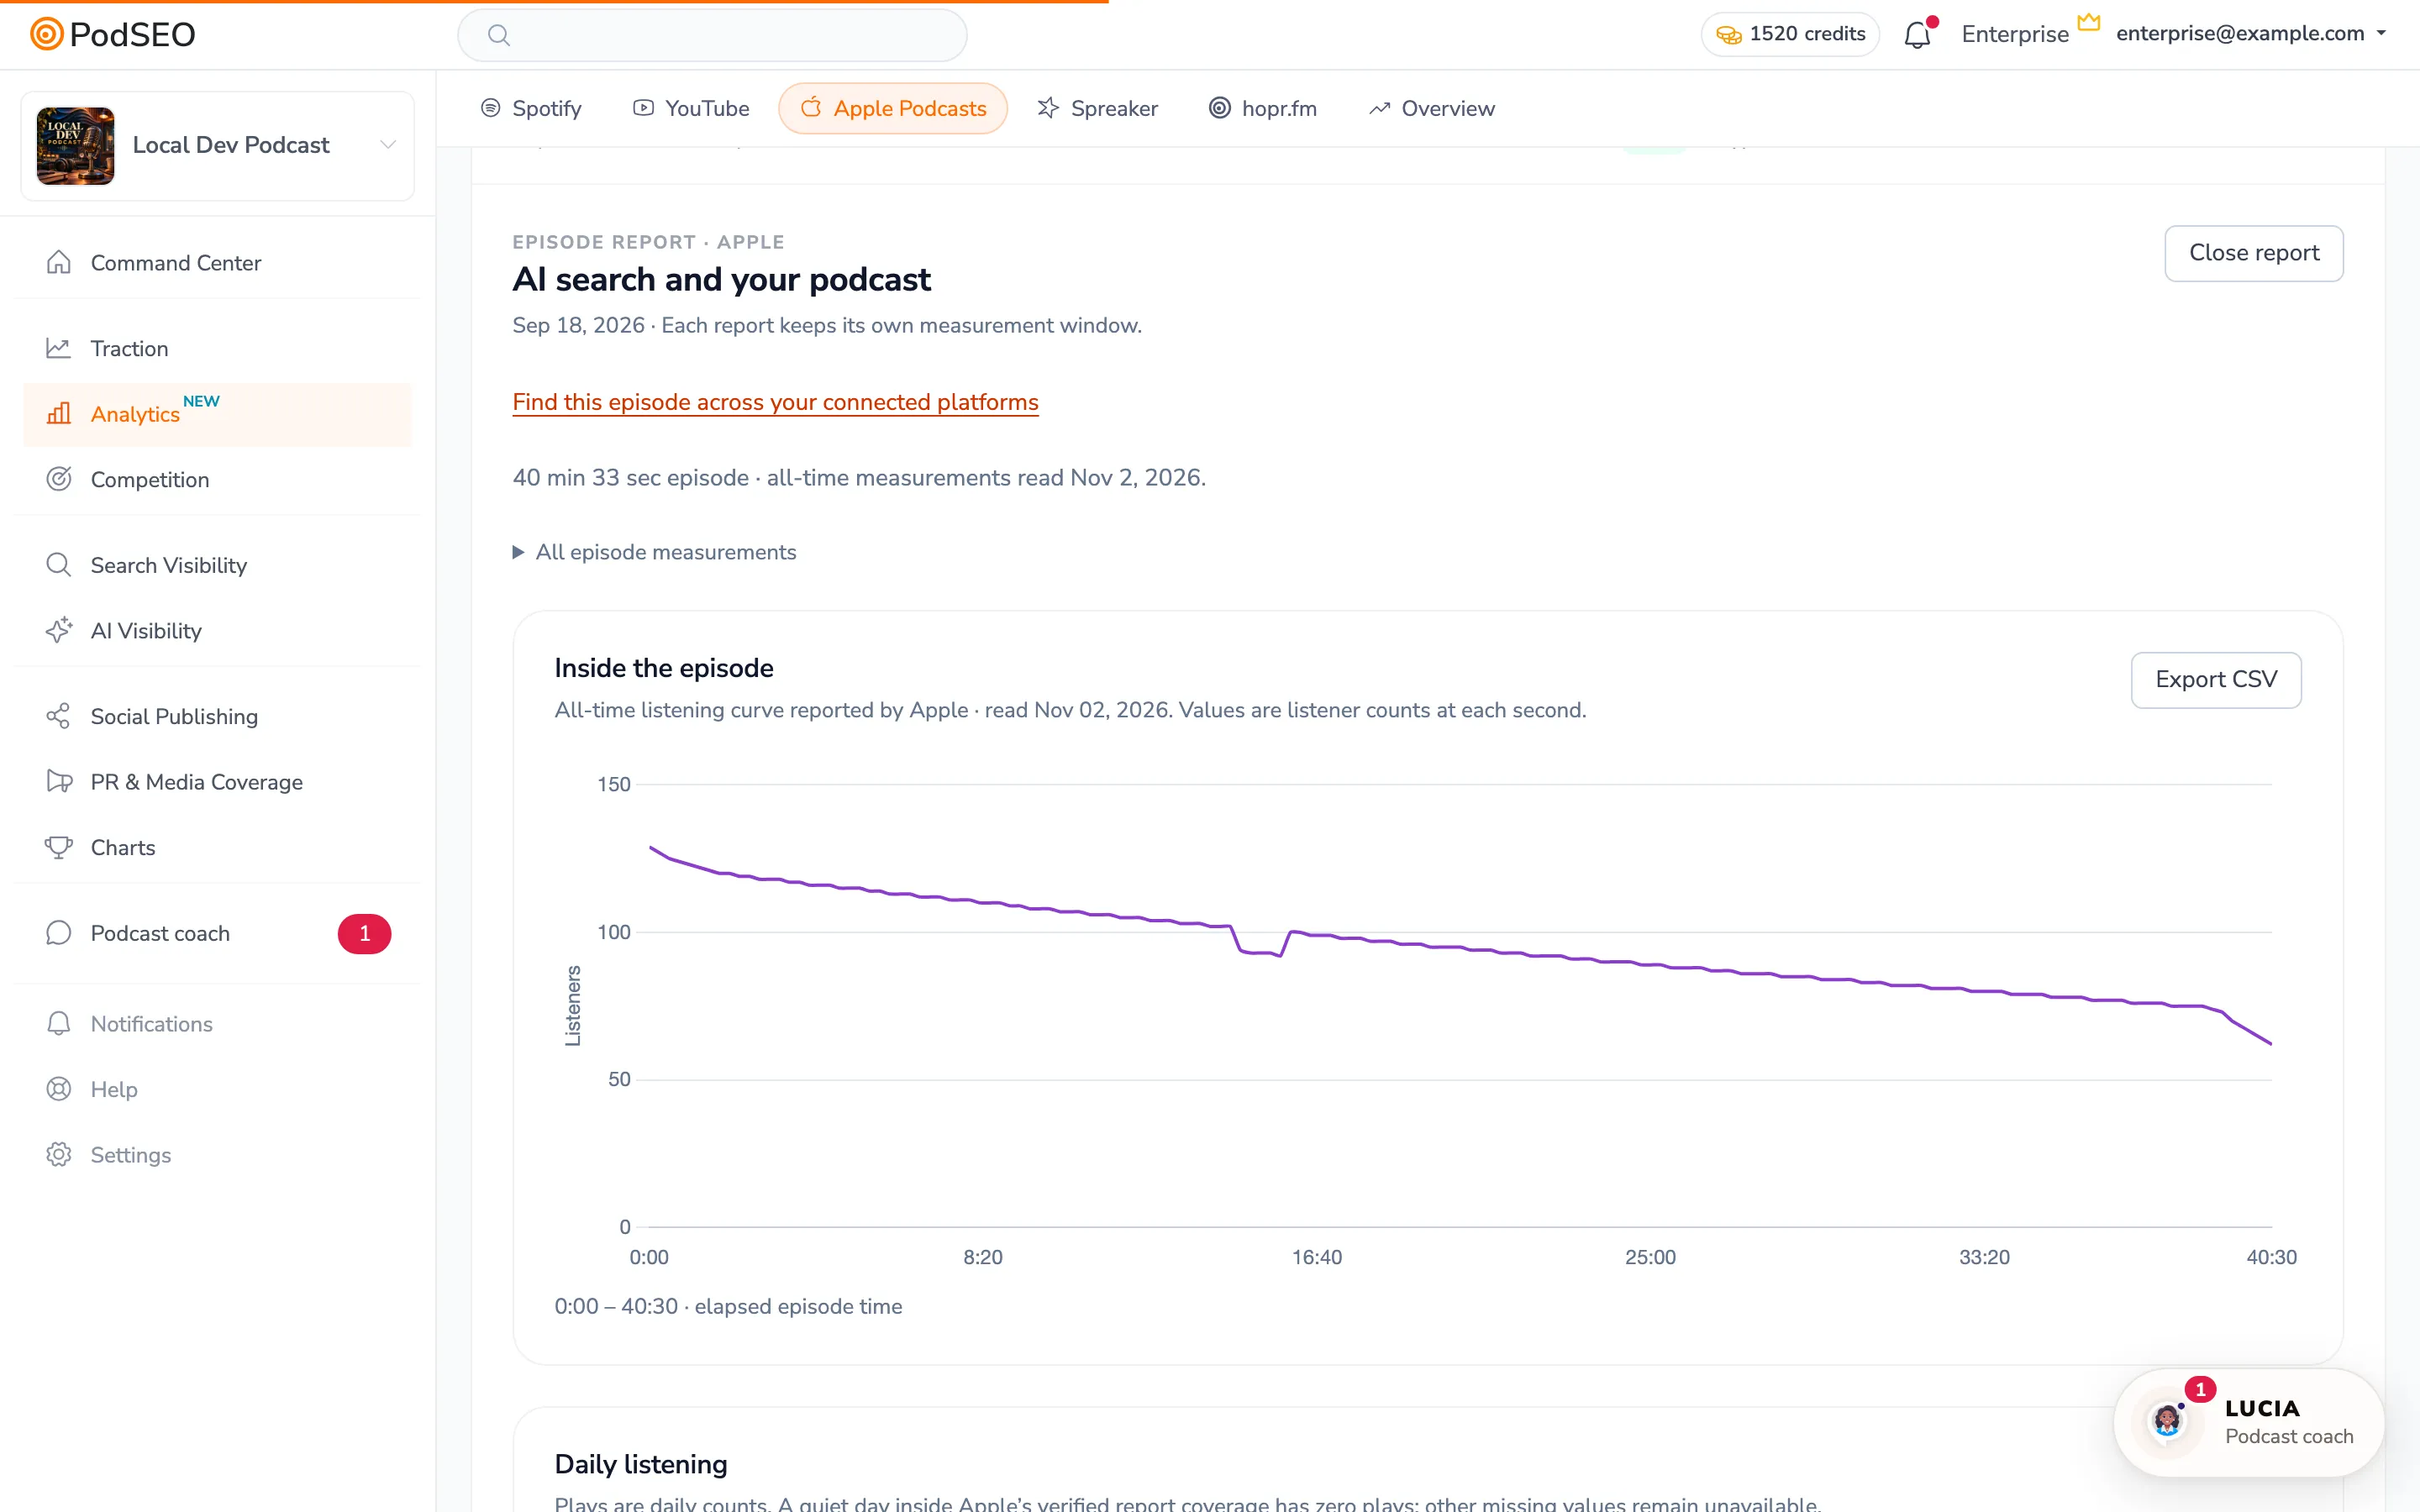
Each chart has Reported values and Export CSV when data is available. A metric selector changes the measurement inside that report; it does not change the period of unrelated cards. Close report collapses the detail back into the episode table.
To compare its Apple curve with Spotify, use Find this episode across your connected platforms. See Compare episode listening curves.
Understand the Audience view
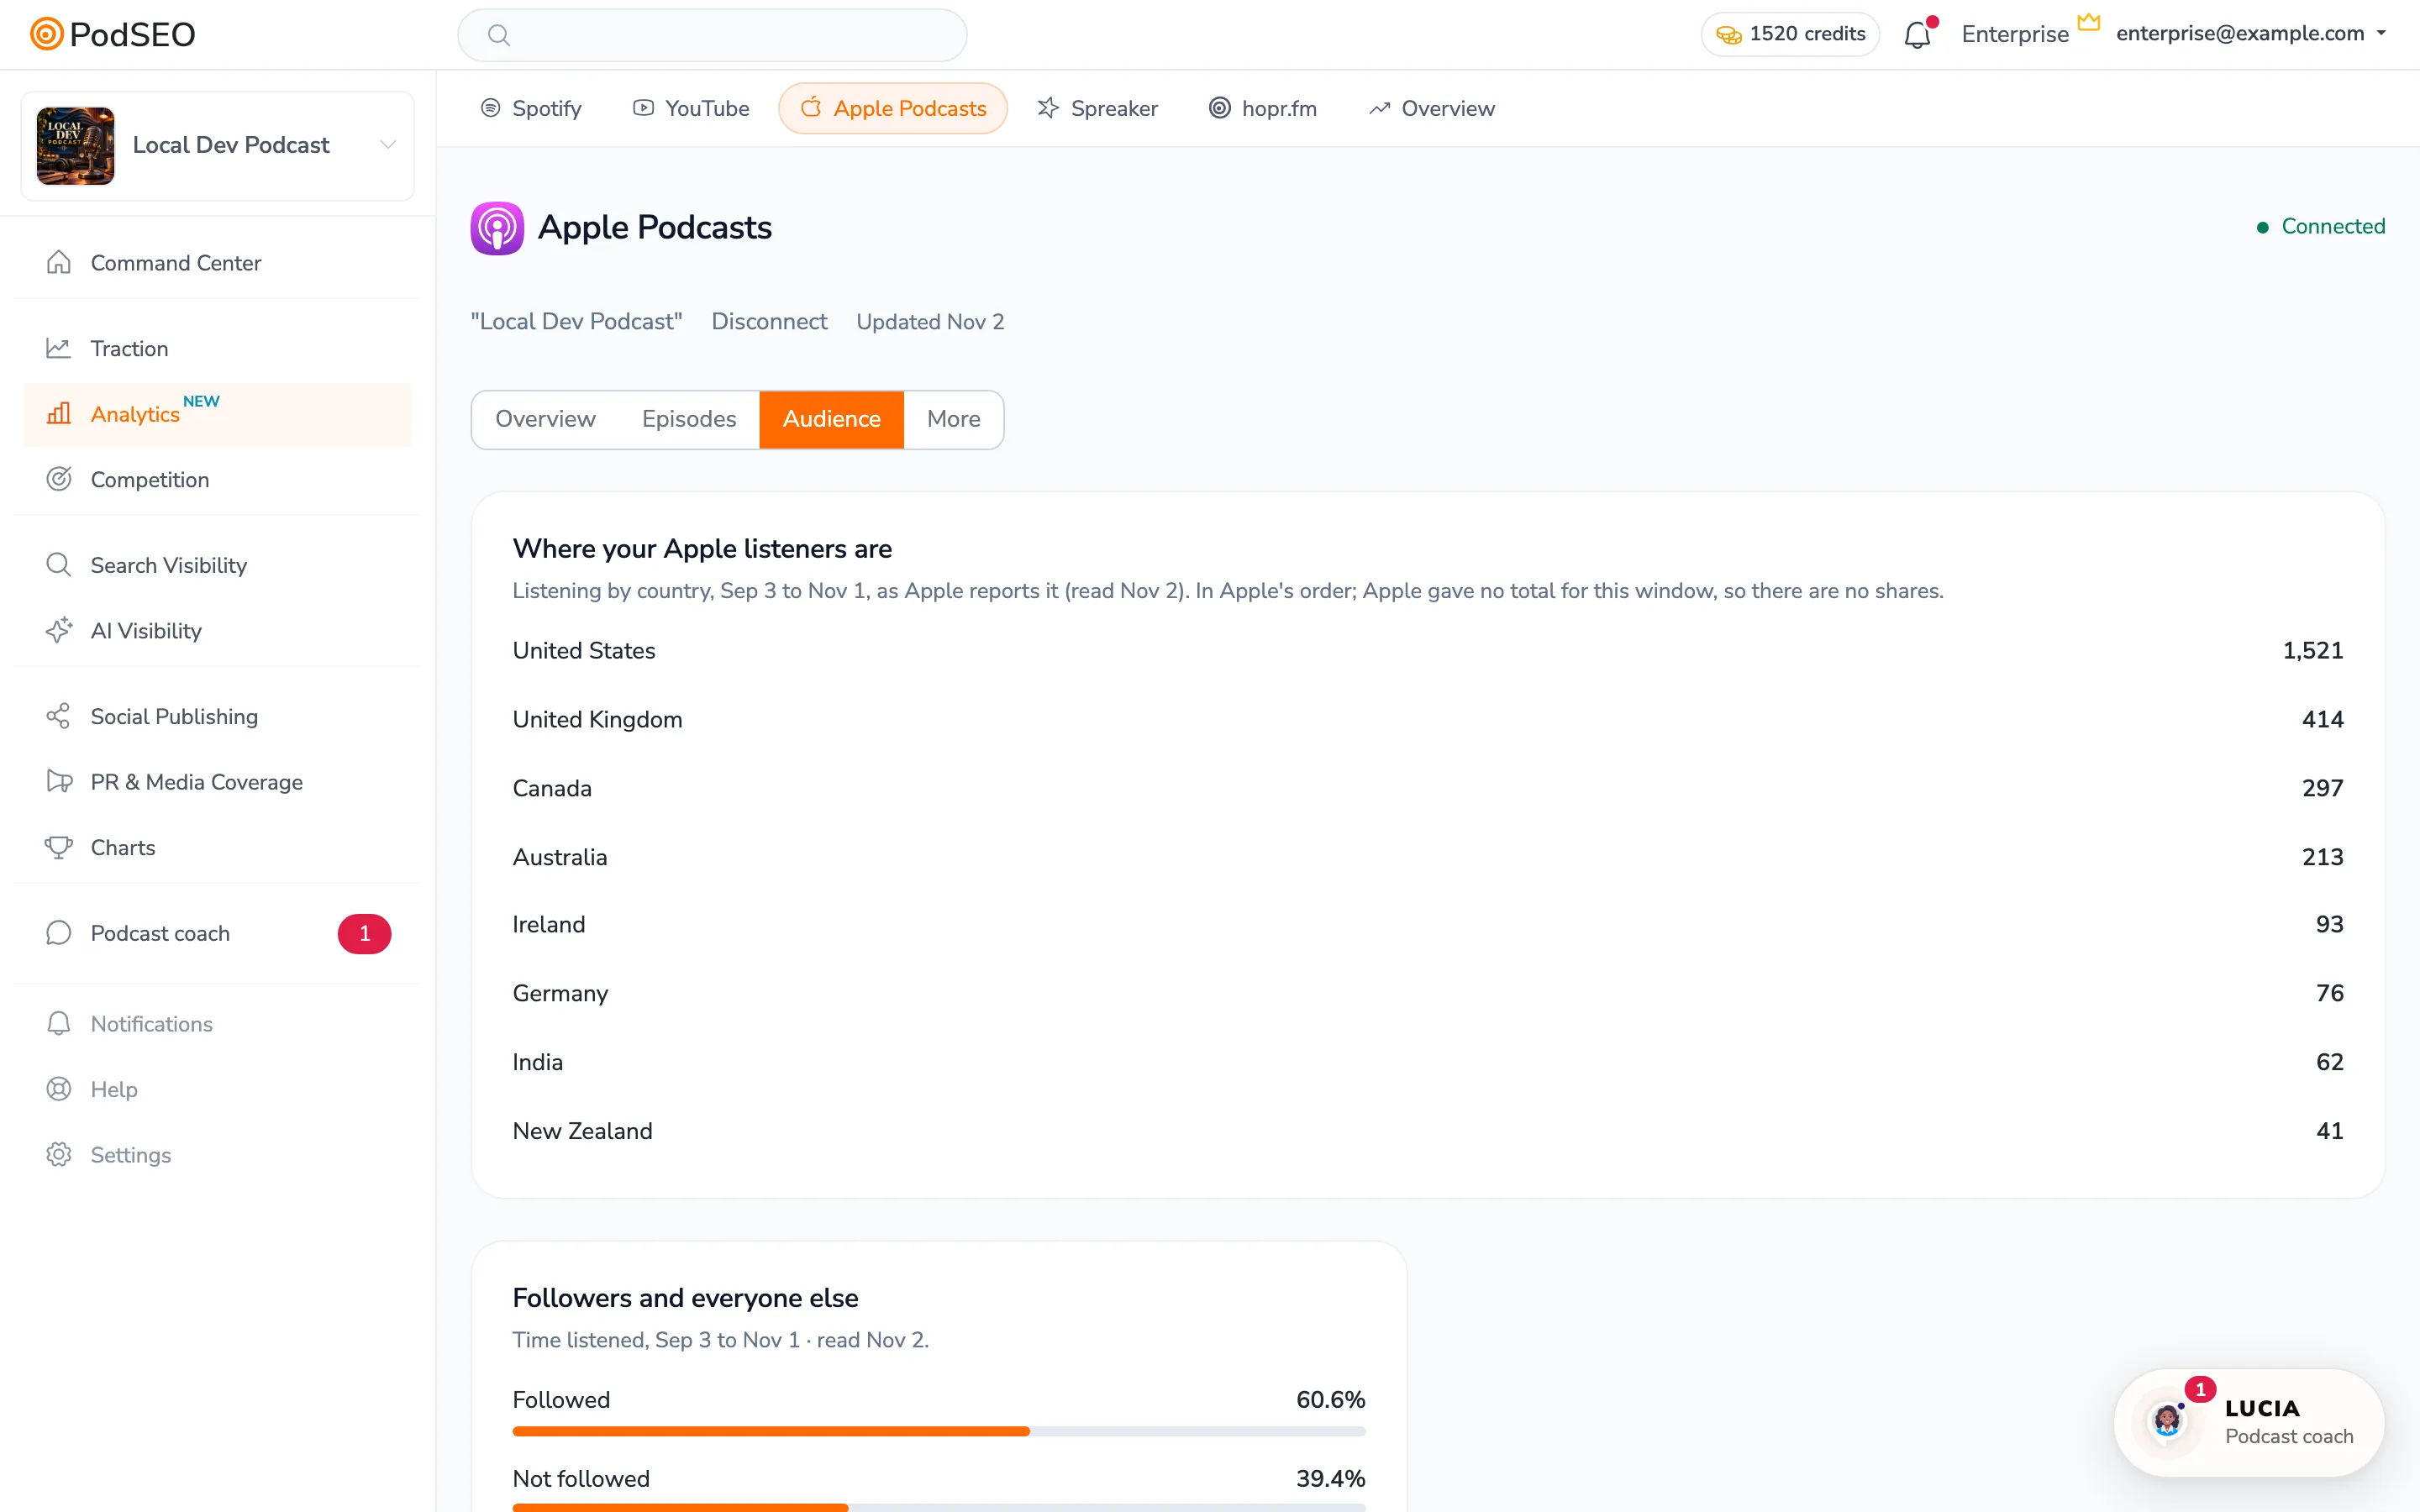
Audience shows countries, top cities and follower comparisons when Apple provides them. A map or share is shown only when a suitable total is available; otherwise read the reported counts and ordering without assuming a percentage. Each card keeps its own measurement and reporting window. Where a country map is available, expand All reported countries and select a country to highlight it and read its reported share.
Audience over time, when available, adds historical reports. Choose the displayed location or measurement and use Show trend where offered. These trends and the latest audience snapshot answer different questions.
Missing values and delayed updates
Open More for Apple's reporting notes. Apple can withhold numbers below five listeners; PodSEO shows unavailable values as “–”, not zero. Apple keeps a limited daily history, while the longer PodSEO views build up as measurements become available. Recent values can be revised.
A delayed warning means the latest available reports remain visible. Check their dates before treating a quiet or missing day as a change in audience. If access was removed, reconnect through the source's instructions; Connections manages existing access.
A useful review routine
Start with plays and hours in Overview, compare episodes at the same age, then open the listening curve for an episode that differs from the others. Use the curve to identify a passage worth reviewing in your audio. A dip alone does not explain why it happened; compare it with the opening, chapter or ad break before changing your format.